Profiler Example : Create a PDF file with images
The Pdf.cfm script is going to create a new PDF file that contains a
number of pages.
Pdf.cfm
<html>
    <head>
        <title> This is a pdf converter </title>
    </head>
    <body>
        <cfdocument format="PDF">
            <cfloop from="1" to="30" index="i">
                <cfset s = gettickcount()>
                <table>
                    <tr>
                        <td>ColdFusion</td>
                        <td>
                            <img src="ColdFusion-Summit-2013.jpg" height="2000" width="2000">
                        </td>
                    </tr>
                    <tr>
                        <td>ColdFusion</td>
                        <td>
                            <img src="ColdFusion-Summit-2013.jpg" height="2000" width="2000">
                        </td>
                        </tr>
                    <tr>
                        <td>ColdFusion</td>
                        <td>
                            <img src="ColdFusion-Summit-2013.jpg" height="2000" width="2000">
                        </td>
                    </tr>
                </table>
            </cfloop>
        </cfdocument>
        </br>
        <cfoutput>
            This is the execution time: #s#
        </cfoutput>
    </body>
    </html>
Profiler Results Page
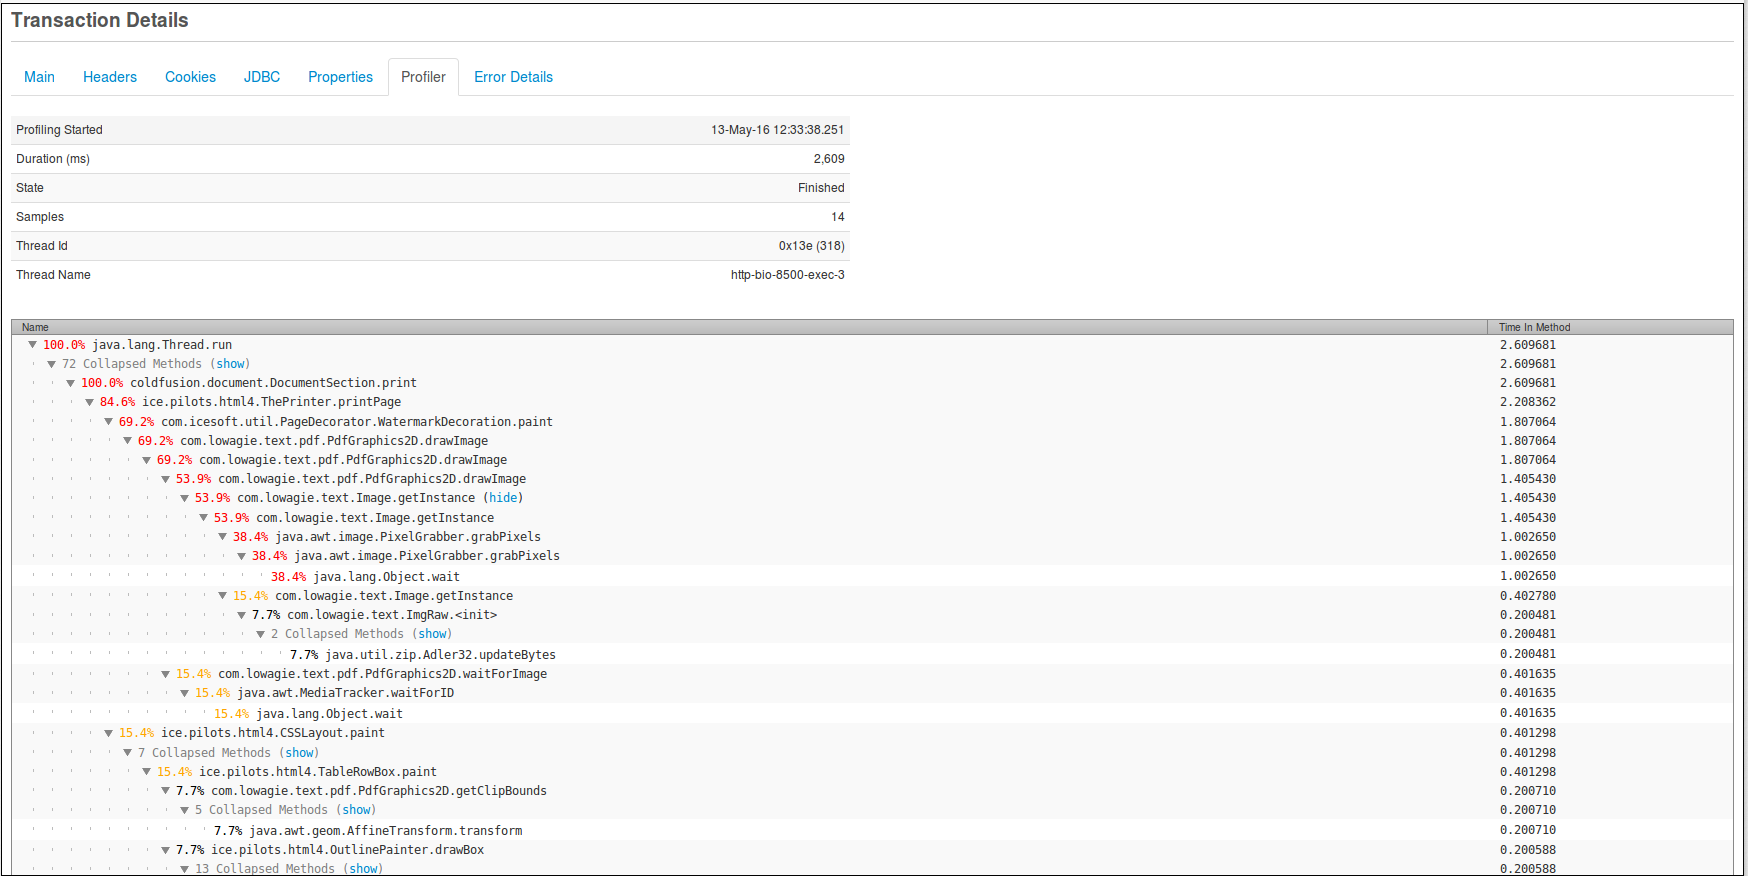
When the execution of the script has finished, go to the Profiled Thread History tab and see the transaction details. ( See screenshot below )

Lets take a better look of the transaction. ( See screenshot below )

If we take a look in the Transaction details, we will be able to see
that the most consuming method is the
ice.pilots.html4.ThePrinter.printPage by
84.6% of the total execution time. Therefore, we can assume that
printing the images in the PDF file consumes a lot of time and is not
characterized as a good programming practice. The second most consuming time function
is com.icesoft.util.PageDecorator.WatermarkDecoration.paint with
69.2% and that function is related to the creation of the PDF
format. Finally, the third most consuming function is the one which
grabs the images and add new dimensions to them based on the code
description.