Python
Introduction
This page shows you how to instrument a simple Python application to ship metrics, traces and logs to FusionReactor Cloud.
There are two steps to this process:
-
Configuring the OTel Collector to act as a local intermediary. The collector accepts data from your Python application and forwards it to FR Cloud. The collector listens on a port, and can also accept data from other local applications.
-
Instrumenting your Python program with OTel function calls.
The example code will be the classic example of computing a Fibonacci sequence by iteration. First, we will configure the OTel collector to run as a local Docker container using a Docker Compose file. Then, we'll show the instrumented code and look at how it works.
Configure and run the OTel collector
Step 1: Create a new configuration
Copy the following YAML code into a file called otel-config.yaml.
Info
Replace the text YOUR_API_KEY with your FusionReactor Cloud API Key.
receivers:
  otlp:
    protocols:
      http:
        endpoint: 0.0.0.0:4318

exporters:
  otlphttp:
    endpoint: "https://api.fusionreactor.io"
    compression: none
    headers:
      authorization: "YOUR_API_KEY"
  prometheusremotewrite:
    endpoint: "https://api.fusionreactor.io/v1/metrics"
    headers:
      authorization: "YOUR_API_KEY"
  loki:
    endpoint: https://api.fusionreactor.io/logs/v1/
    headers:
      authorization: "YOUR_API_KEY"
  logging:
    verbosity: detailed

service:
  pipelines:
    metrics:
      receivers: [ otlp ]
      exporters: [ prometheusremotewrite ]
    traces:
      receivers: [ otlp ]
      exporters: [ otlphttp ]
    logs:
      receivers: [ otlp ]
      exporters: [ loki ]
Note
Once this file exists, in future you can skip this step.
Step 2: Create a Docker Compose configuration
Copy the following YAML code into a file called compose.yaml.
# Docker Compose file for the Otel (Contrib) Collector
# Intergral GmbH 2023

version: "3"

services:

  otel-contrib-collector:
    image: otel/opentelemetry-collector-contrib
    ports:
      - 4318:4318 # Otel receiver
    restart: always
    volumes:
      - ./otel-config.yaml:/etc/otelcol-contrib/config.yaml
    environment:
      - OTEL_RESOURCE_ATTRIBUTES="job=unknown"  # Used if the client doesn't supply a job name
Step 3: Start a Docker container with the collector
In the same directory as your otel-config.yaml and compose.yaml files, run the following command:
docker compose up
The container starts and emits something similar to the following log output:
[+] Building 0.0s (0/0)                                                                                  docker:desktop-linux
[+] Running 1/0
 ✔ Container collector-otel-contrib-collector-1  Created                                                                 0.0s
Attaching to collector-otel-contrib-collector-1
To stop the container, in the compose terminal window, press [CTRL-C] on the keyboard.
Instrument and run your Python code
Procedure
Step 1: Download Python library dependencies
Install the OpenTelemetry supporting libraries using Pip:
pip install opentelemetry-api
pip install opentelemetry-sdk
pip install opentelemetry-exporter-otlp-proto-http
Step 2: Instrument your code
The following listing can be saved as fib.py and run using:
python fib.py 20
The program will output 20 rounds of Fibonacci computation and then exit.
# Fibonacci by Iteration
# Example Python code for FR Cloud integration
# Intergral GmbH 2023

# Required by program
import sys

# Support for instrumentation
import logging

# Instrumentation Libraries
from opentelemetry.sdk.resources import Resource

# Exporters
from opentelemetry.exporter.otlp.proto.http.trace_exporter import OTLPSpanExporter
from opentelemetry.exporter.otlp.proto.http.metric_exporter import OTLPMetricExporter
from opentelemetry.exporter.otlp.proto.http._log_exporter import OTLPLogExporter

# Trace Import
from opentelemetry.trace import set_tracer_provider
from opentelemetry.sdk.trace import TracerProvider, sampling
from opentelemetry.sdk.trace.export import BatchSpanProcessor
from opentelemetry.semconv.resource import ResourceAttributes

# Metric Import
from opentelemetry.sdk.metrics.export import (
    PeriodicExportingMetricReader,
)
from opentelemetry.sdk.metrics import MeterProvider
from opentelemetry.metrics import set_meter_provider, get_meter_provider

# Logs Import
from opentelemetry.sdk._logs import LoggerProvider, LoggingHandler
from opentelemetry.sdk._logs.export import BatchLogRecordProcessor
from opentelemetry._logs import set_logger_provider


def fib(iterations: int):
    total: int = 0
    last: int = [0, 1]
    iteration: int = 0

    tracer = TRACER_PROVIDER.get_tracer("fib_tracer")
    meter = get_meter_provider().get_meter("fib_meter")
    iteration_counter = meter.create_counter(name="fib_iteration_counter",
                                             description="The number of iterations")

    # Start an OTEL span to trace the whole execution
    with tracer.start_as_current_span("fib-outer") as span:
        span.set_attribute("iterations", iterations)

        while iteration < iterations:
            with tracer.start_as_current_span('fib-inner') as inner_span:
                inner_span.set_attribute("iteration", iteration)

                iteration += 1
                iteration_counter.add(amount=1)

                # Find the next number in the sequence by summing the last two
                new_number = sum(last)

                # Push the new number into the last array, discarding the earliest
                last[0] = last[1]
                last[1] = new_number

                logging.info(f'{new_number} ')


def initialize_otel(endpoint: str) -> (TracerProvider, MeterProvider, LoggerProvider):
    logging.debug("Initialize OTEL")

    # Global resources
    resource = Resource.create(
        attributes={ResourceAttributes.SERVICE_NAME: 'fib_by_iteration'})

    # Tracing

    tracer_provider: TracerProvider = TracerProvider(sampler=sampling.ALWAYS_ON, resource=resource)
    set_tracer_provider(tracer_provider)
    tracer_provider.add_span_processor(
        BatchSpanProcessor(
            OTLPSpanExporter(
                endpoint=endpoint + '/v1/traces'
            )
        )
    )

    # Metrics

    exporter = OTLPMetricExporter(endpoint=endpoint + "/v1/metrics")
    reader = PeriodicExportingMetricReader(exporter)
    meter_provider = MeterProvider(metric_readers=[reader], resource=resource)
    set_meter_provider(meter_provider)

    # Logging

    logger_provider = LoggerProvider(resource=resource)
    set_logger_provider(logger_provider)
    logger_provider.add_log_record_processor(
        BatchLogRecordProcessor(OTLPLogExporter(
            endpoint=endpoint + '/v1/logs')
        )
    )
    handler = LoggingHandler(level=logging.NOTSET, logger_provider=logger_provider)

    # Use the OTLP logging handler to send logs.
    logging.getLogger().addHandler(handler)

    # Return the created providers
    return tracer_provider, meter_provider, logger_provider


# Set up our own logging
logging.basicConfig(level="INFO")
logging.info("Starting up")

# Set up the OTEL agent to talk to the collector
TRACER_PROVIDER, METER_PROVIDER, LOG_PROVIDER = initialize_otel("http://localhost:4318")

# Process out command line options and actually run the sequence
iters: int = int(sys.argv[1])
logging.info(f'Fibonacci by Iteration - {iters} rounds\n')
fib(iters)

logging.info("... Fibonacci complete.")
Code commentary
The program above is broken down into two functions and the main body of the script:
-
def fib(...):
This function calculates a Fibonacci sequence by iterating a given number of times and uses the metric, span and logging providers to send data to the collector on port 4318. An outer span (fib-outer) is created to trace the overall iteration, while inner spans (fib-inner) are created for each iteration. The current iteration number is set as an attribute (span.set_attribute(...)) on the inner span. The current Fibonacci number is written to the log (logging.info(...)) and will be also sent to the Collector implicitly by the Otel log handler. Finally, a metric counter (iteration_counter) is incremented for every iteration the loop processes. -
def initialize_otel(...):
This function, which takes the URL of the collector endpoint, creates and returns the three Otel providers required to ship data: atracer_provider, ameter_provider, and alogger_provider. You can see all three providers are constructed with the sameResourceobject, whoseSERVICE_NAMEisfib_by_iteration. This will be transferred to FR Cloud as thejobkey, and used to later find our data. -
The main body of the script at the bottom of the file simply sets up logging, calls
initialize_otel(...)in order to get the providers - which are stored as global variables - and finally callsfib(...)to actually do the work.
3. Finding your data in FusionReactor Cloud
Run the code a few times to generate some shipped metrics.
Metrics
In the FR Cloud Explore window, ensure the Metrics datasource is selected. Then either use the Builder to find
our metric (you can search for job: fib_by_iteration) or use the following in the Code search
mode: fib_iteration_counter_total{job="fib_by_iteration"}.
You'll get a graph and table of the metric.
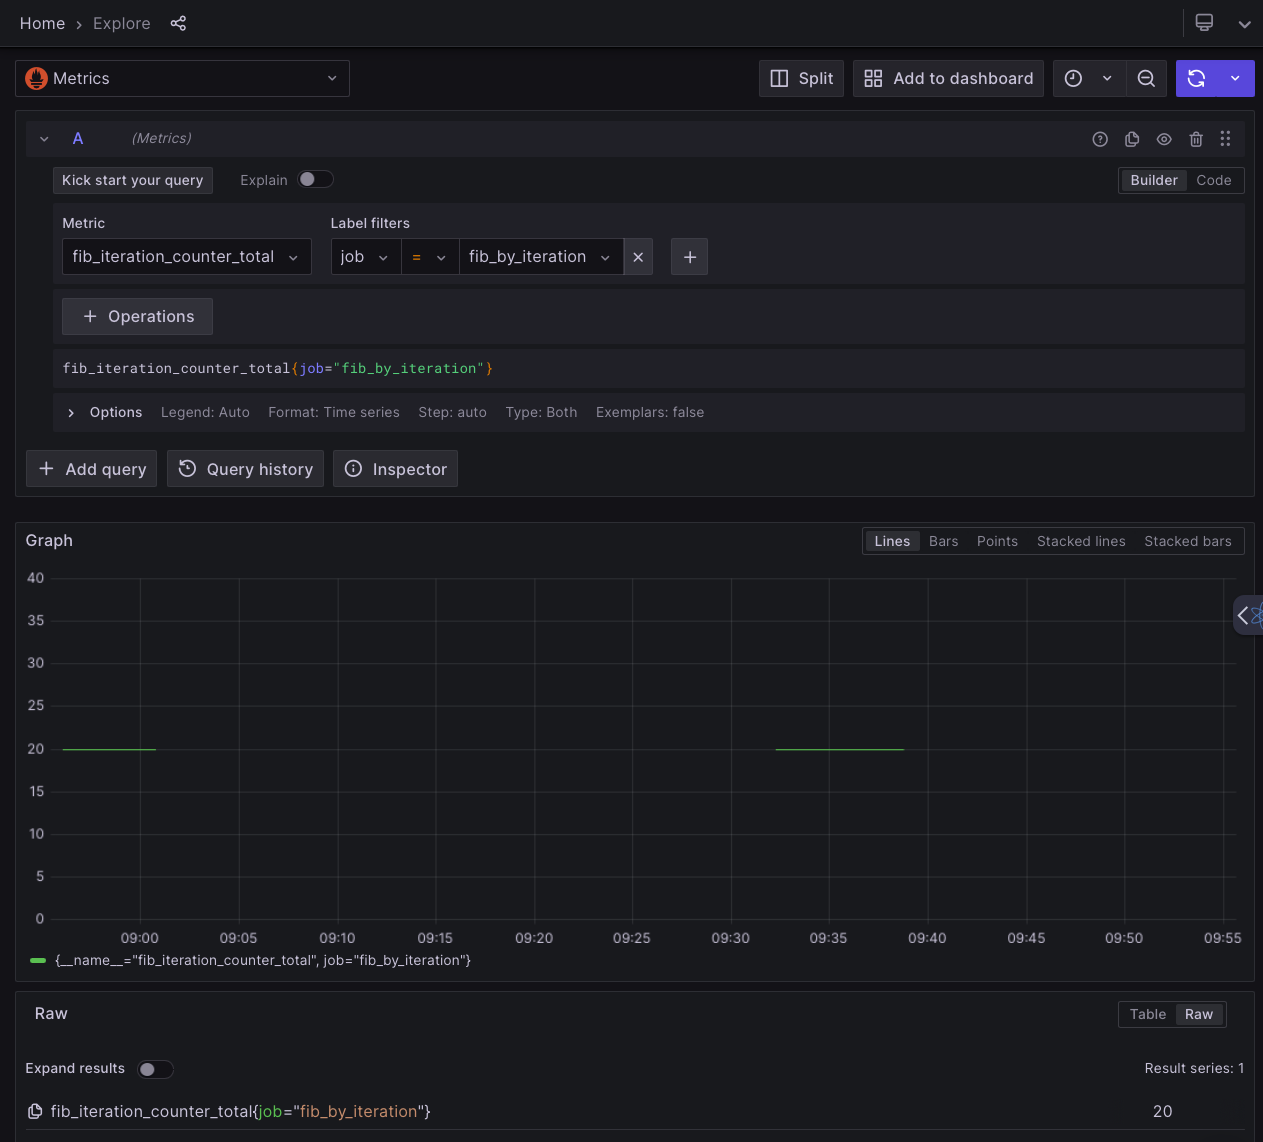 Metrics supplied by Python
Traces
In the FR Cloud Explore window, ensure the Traces datasource is selected. Using the Search query type,
select Resource Service Name = fib_by_iteration. Click the blue spinner at the top left to execute the query.
Several fib-outer spans should be returned. Click one to open the span split view, which should show the inner spans
for that execution. Inner spans on the right can be clicked to open them, revealing more information - including the
attribute we set in code: iteration.
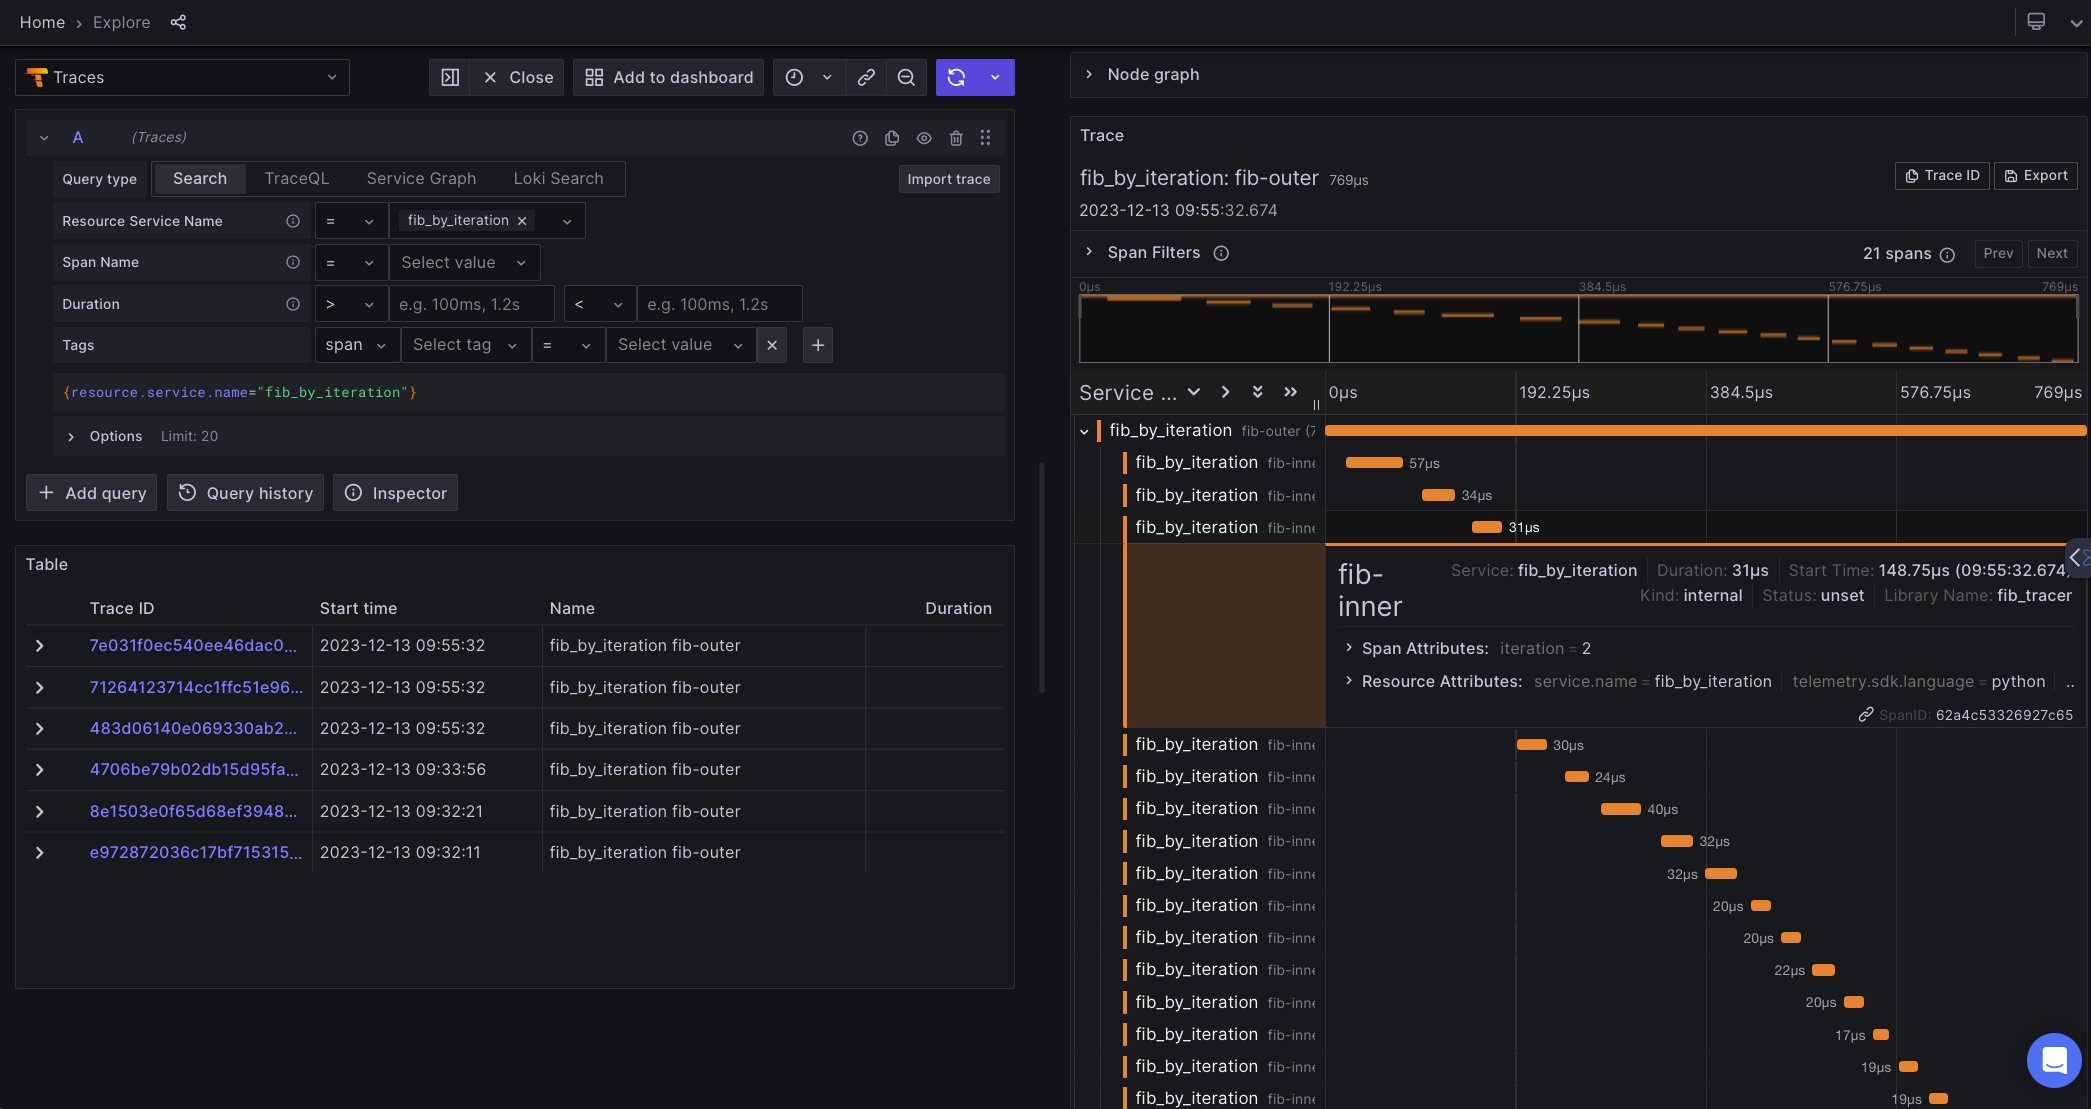 Traces supplied by Python
Logs
In the FR Cloud Logging window, open the Job dropdown and select fib_by_iteration. All the log message emitted
by the Python code appear.
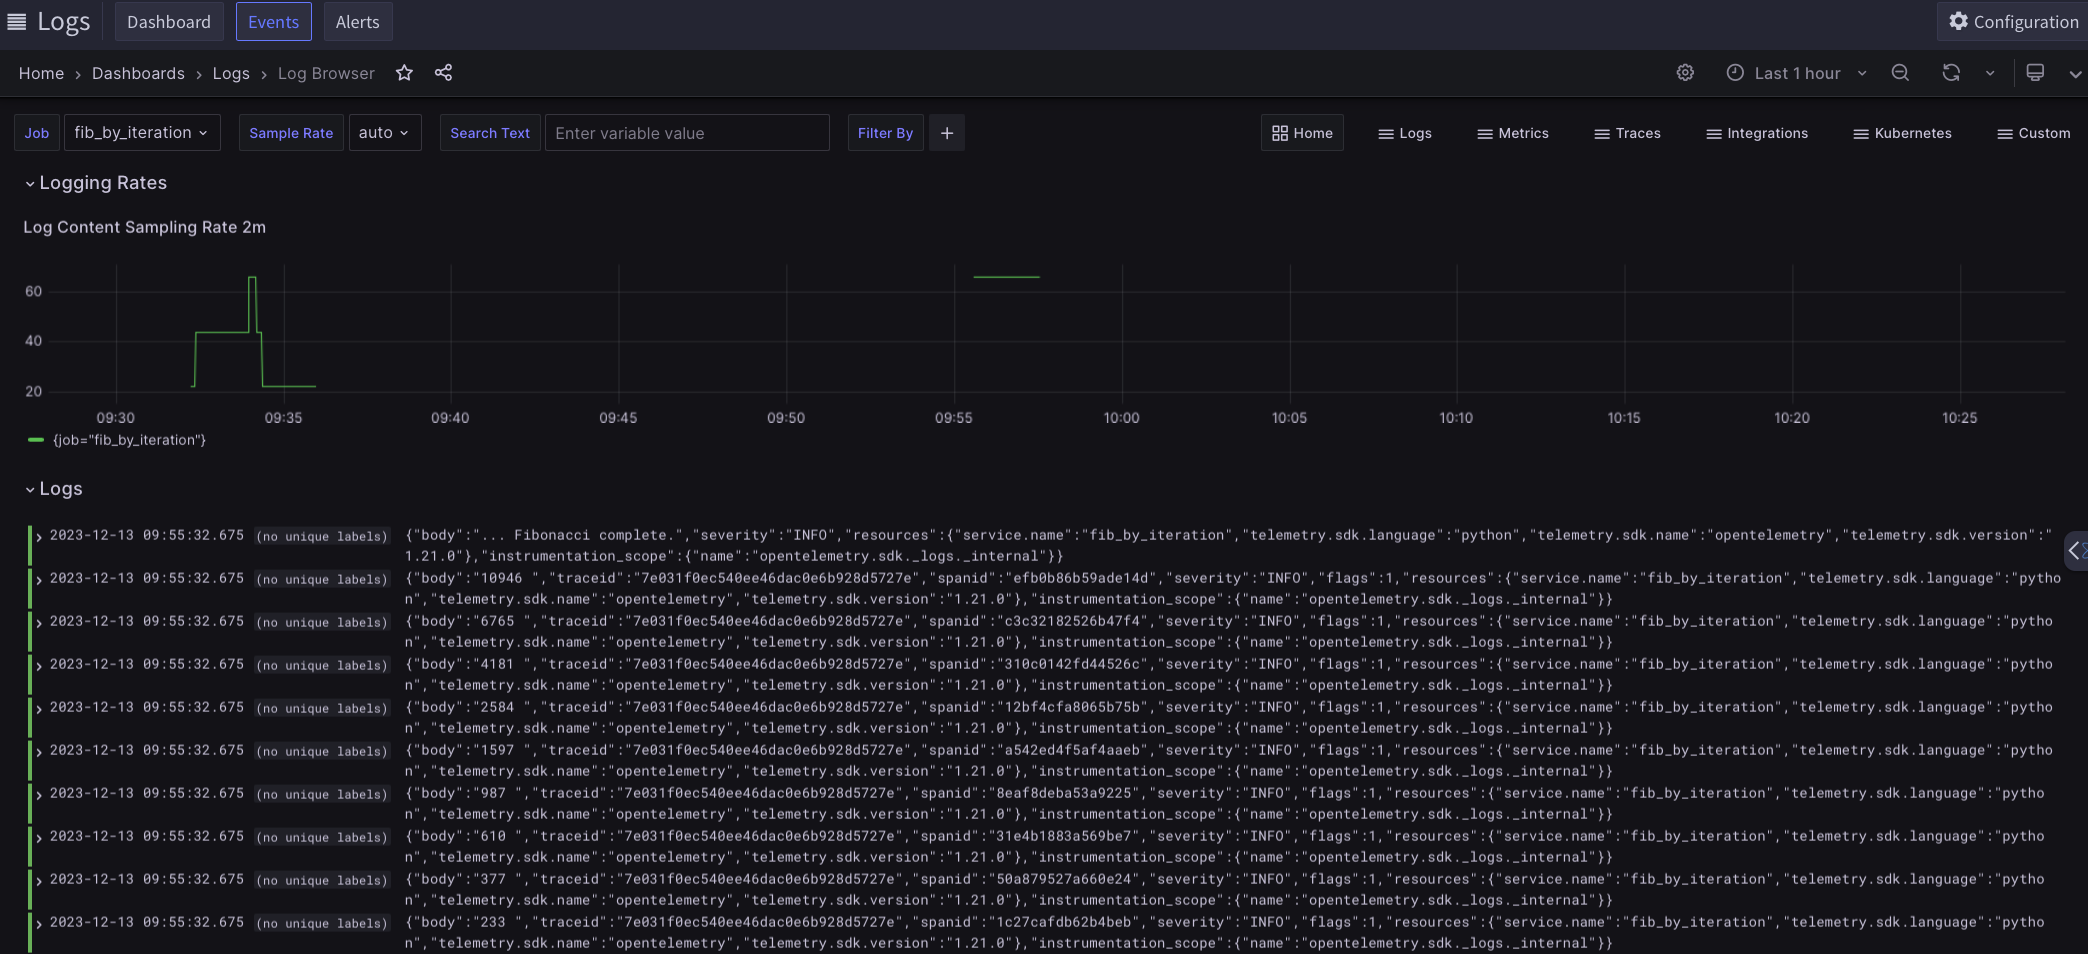 Logs supplied by Python
Need more help?
Contact support in the chat bubble and let us know how we can assist.