What's new in FR
OpsPilot updates
We're excited to announce two major updates to OpsPilot! First, our new agentic system for querying metrics data enhances your experience with dynamic, relevant insights, more frequent and accurate graphs, and quicker response times. Second, we've introduced the ability to scrape websites and ingest their content directly into your knowledge base, expanding the ways you can gather and utilize information. These updates empower you to gain deeper insights and build a more comprehensive knowledge repository effortlessly.
OpsPilot Integrations
We're excited to announce OpsPilot's latest integrations with Microsoft Teams and Slack, bringing powerful monitoring capabilities directly into your team's daily workflow.
No more context switching! Capture all monitoring details and troubleshoot issues right where your team already collaborates. Whether you're checking performance metrics, investigating errors, or sharing insights with your team, OpsPilot now brings monitoring to your preferred platform.
Ready to streamline your monitoring workflow? Visit our OpsPilot Hub to get started.
Microsoft Teams Integration
- Direct Access: Query OpsPilot with @mentions in any Teams channel
- Suggested Prompts: Get started quickly with pre-built monitoring queries
- Interactive Links: Jump directly to detailed FusionReactor views
- Team-Wide Insights: Share monitoring data seamlessly in team discussions
Learn more
Slack Integration
- Smart Interactions: Access OpsPilot through DMs or channel mentions
- Visual Feedback: Track request status with intuitive emoji indicators
- Context-Aware: Reviews up to 20 messages for better understanding
- Thread Support: Keep monitoring discussions organized
Learn more
Jira Integration
OpsPilot now integrates directly with Jira Data Center, enabling you to:
- Create and track issues directly through OpsPilot.
- Search and comment on existing tickets.
- Manage tickets across your selected projects.
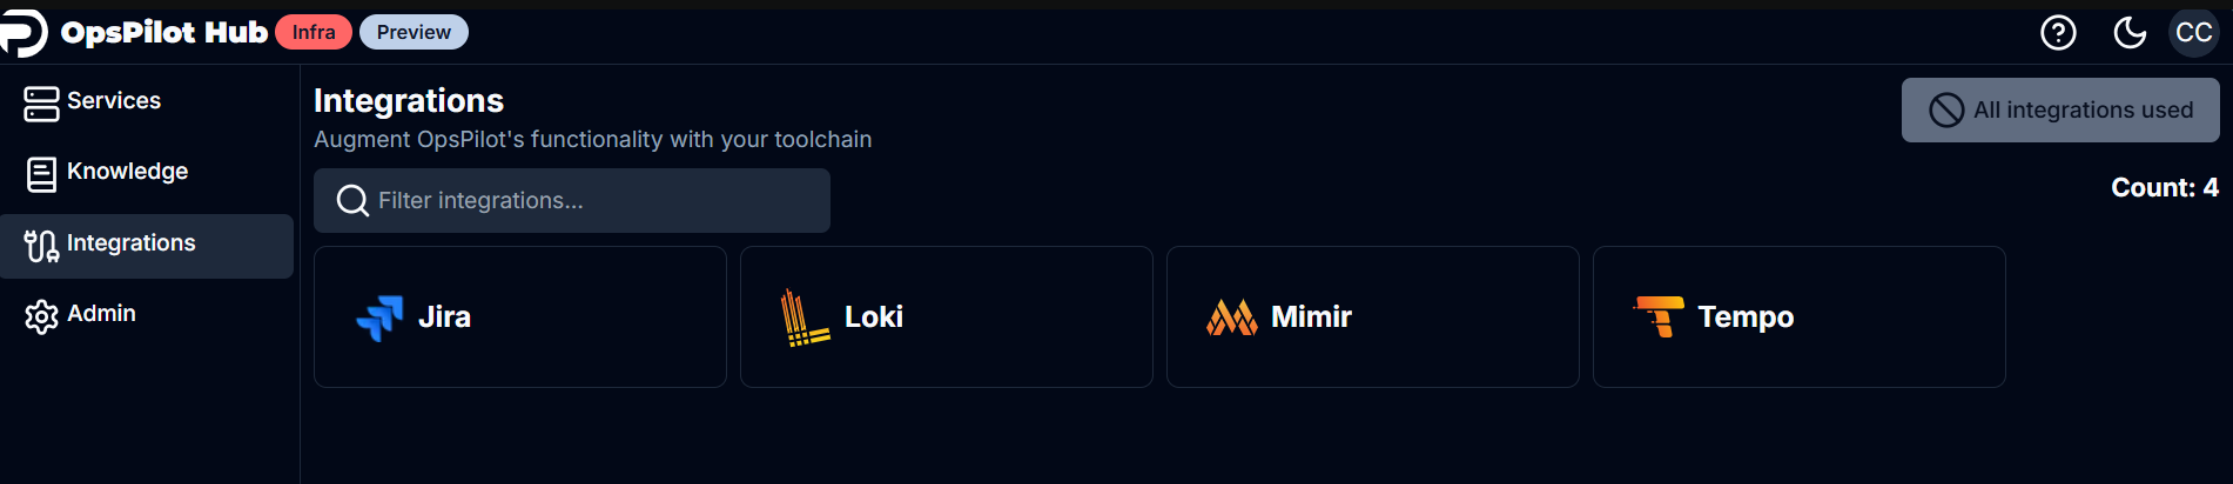
Learn more
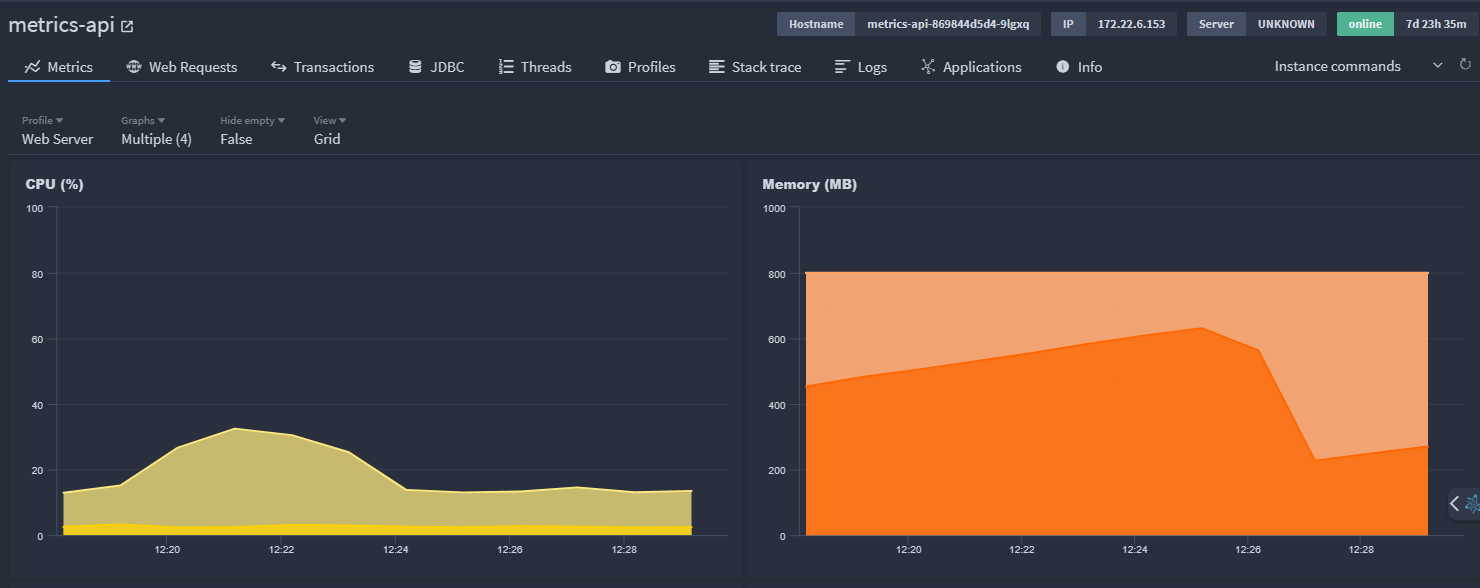
Explore: Servers
The new Servers tab in Explore provides enhanced server monitoring capabilities:
- Real-time metric tiles with traffic light status indicators.
- Key performance metrics including CPU, memory, and throughput.
- Detailed performance graphs for trend analysis.
- Advanced filtering by client ID and server groups.
- Customizable time ranges for precise monitoring.
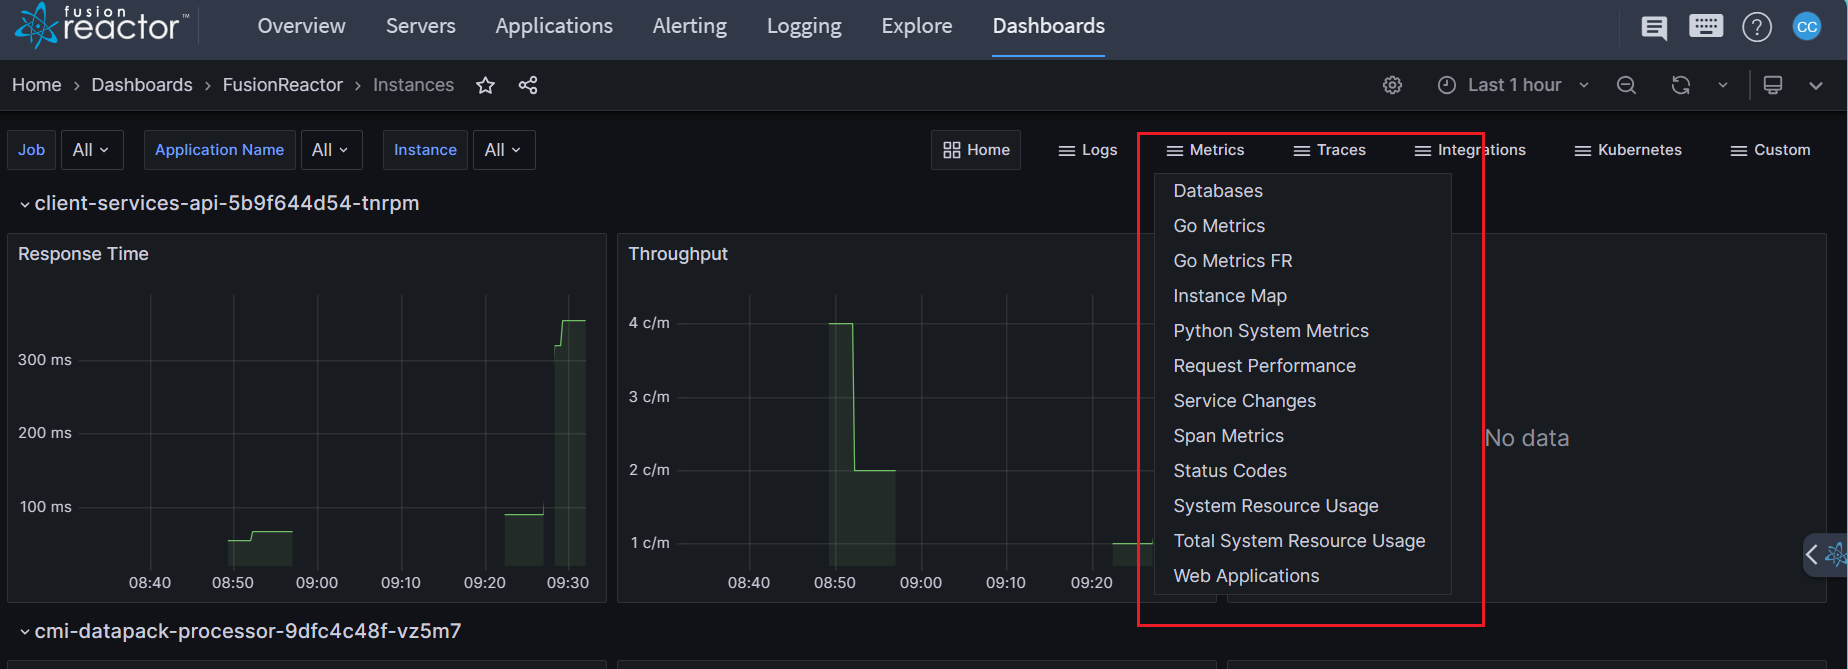
Explore: Metrics
A powerful new addition to the Explore suite that will revolutionize how you visualize and analyze your Prometheus-compatible metrics:
- Browse metrics without writing complex queries.
- Interactive metric previews with real-time graphs.
- Advanced filtering and labeling capabilities.
- Customizable time ranges and view options.
- Unified search across all metric names.
OpsPilot 1.3.0
Introducing OpsPilot Hub: Your centralized knowledge repository for enhanced operational efficiency available in the OpsPilot 1.3.0 release. This new feature serves as the backbone for the OpsPilot AI Assistant, allowing you to store and manage critical operational information. With OpsPilot Hub, you can document your services, add custom metadata, and upload various types of knowledge through snippets and files. The intuitive interface includes progress tracking for service documentation, tagging for easy organization, and powerful filtering options. By centralizing your organization's information, OpsPilot Hub empowers the AI Assistant to provide more accurate, context-aware solutions to your team's operational challenges.
Learn more
FusionReactor 12.1
Java 21 Support
FusionReactor 12.1 introduces comprehensive support for applications running on Java 21, the latest long-term support release of the Java platform. This update ensures full compatibility and optimal performance monitoring for Java 21 environments. Users can now track transactions and requests on Java 21 with the same depth and accuracy as previous Java versions. The seamless performance monitoring extends to all applications that have been upgraded to Java 21, allowing development teams to confidently adopt the latest Java features while maintaining robust application insights.
Cloud UI WebSocket Tunnel
A groundbreaking feature in this release is the Cloud UI WebSocket Tunnel, which enables users to browse on-premises agent's UI directly through the FusionReactor Cloud website. This innovation facilitates seamless navigation between cloud and on-premises resources, providing a unified experience for managing distributed environments. The WebSocket Tunnel significantly reduces the need for complex port connections or intricate networking setups, simplifying the overall management process for DevOps teams. This feature is particularly beneficial for organizations with strict firewall policies or those managing applications across various network environments.
Cloud Credentials for Agent Login
FusionReactor 12.1 enhances user authentication by allowing login to on-premise FusionReactor agents using FR Cloud credentials. This integration enables centralized user management through the FR Cloud platform, streamlining access control across multiple environments. The cloud-based authentication mechanism provides enhanced security, leveraging robust cloud security protocols to protect sensitive monitoring data. Teams managing multiple agents across different locations will find the login process significantly simplified, reducing the overhead of credential management and improving overall operational efficiency. This feature is especially valuable for large enterprises with distributed teams and complex application architectures.
These new features in FusionReactor 12.1 provide:
-
Support for the latest Java developments
-
Improved integration between cloud and on-premises environments
-
Streamlined monitoring workflows
Custom Detectors
FusionReactor Cloud has been upgraded with new Custom Detectors, enhancing its anomaly detection capabilities. This feature allows for more precise monitoring and diagnostics of your application's performance. While setting up Custom Detectors requires manual input and some knowledge of PromQL, they offer exceptional customization, letting you set specific conditions or thresholds that match your application's particular requirements.
To help you begin, FusionReactor Cloud provides three pre-configured custom detectors specifically designed for Java and ColdFusion users. It's important to note that if you're not using Java or ColdFusion, these default detectors may not be directly applicable to your environment. However, regardless of your technology stack, you have the freedom to create your own custom detectors for monitoring CPU, memory, or any other crucial resources relevant to your specific application. This flexibility enables accurate identification of performance bottlenecks and potential issues across various technologies, helping maintain your application's efficiency and reliability.
Learn more
Enhanced On-Prem billing experience
We’ve listened to your feedback and are excited to announce that we’ve upgraded to a new billing platform powered by Stripe, designed with your convenience in mind. Enjoy a smoother, more flexible billing experience, addressing challenges with updating credit card details and adjusting product quantities. Managing subscriptions is now really easy in the new billing system, as you can add or remove seats directly within the product without needing to call sales or support.
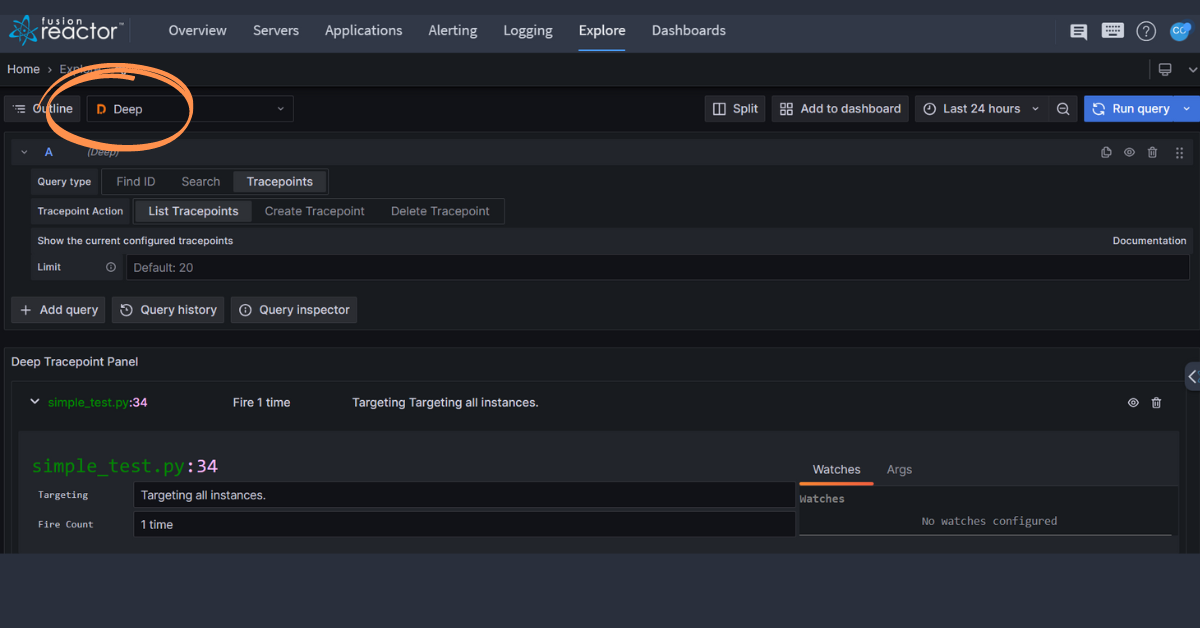
Deep
FusionReactor's new Deep integration provides AI powered root cause analysis to help solve issues quickly and instantly debug in production with no restart or redeploy required. With Deep, your team are able to concentrate on delivering innovative features rather than spending valuable time debugging.
OpsPilot 1.2.0
With version 1.2.0, OpsPilot introduces exciting new features and improvements to enhance user experience, streamline workflows, and deliver even more powerful monitoring and management capabilities.
New feature
- OpsPilot Vision: OpsPilot introduces OpsPilot Vision, a groundbreaking feature that enriches its capabilities by allowing users to upload images for added context to their inquiries. With OpsPilot Vision, users can now provide supplementary visual information alongside their questions, enabling OpsPilot to deliver more comprehensive and tailored responses. This integration enhances the overall user experience, fostering greater clarity and effectiveness in communication.
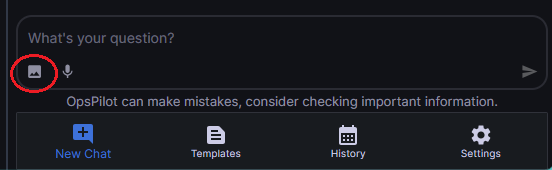
Learn more
- Updated FR knowledge base: OpsPilot has undergone a significant upgrade in its FusionReactor knowledge base, resulting in enhanced proficiency in understanding and addressing issues. With this improvement, OpsPilot can now provide more informed and effective responses when dealing with FusionReactor-related tasks. This advancement promises smoother operations and quicker resolutions, ultimately optimizing system performance and minimizing downtime.
- Continue On Error: In the event that OpsPilot encounters an issue while responding, users now have the option to choose between retrying the operation or continuing the conversation seamlessly without interruption.
Improvements
-
Alarm refinement - In response to user feedback, OpsPilot has undergone optimization to refine its alarm notification system. With this update, when OpsPilot notifies users of detected alarms during its task list processing, it will no longer repeat identical alarm notifications. This refinement ensures a more focused and efficient user experience by eliminating redundancy and providing clear, actionable notifications when necessary.
-
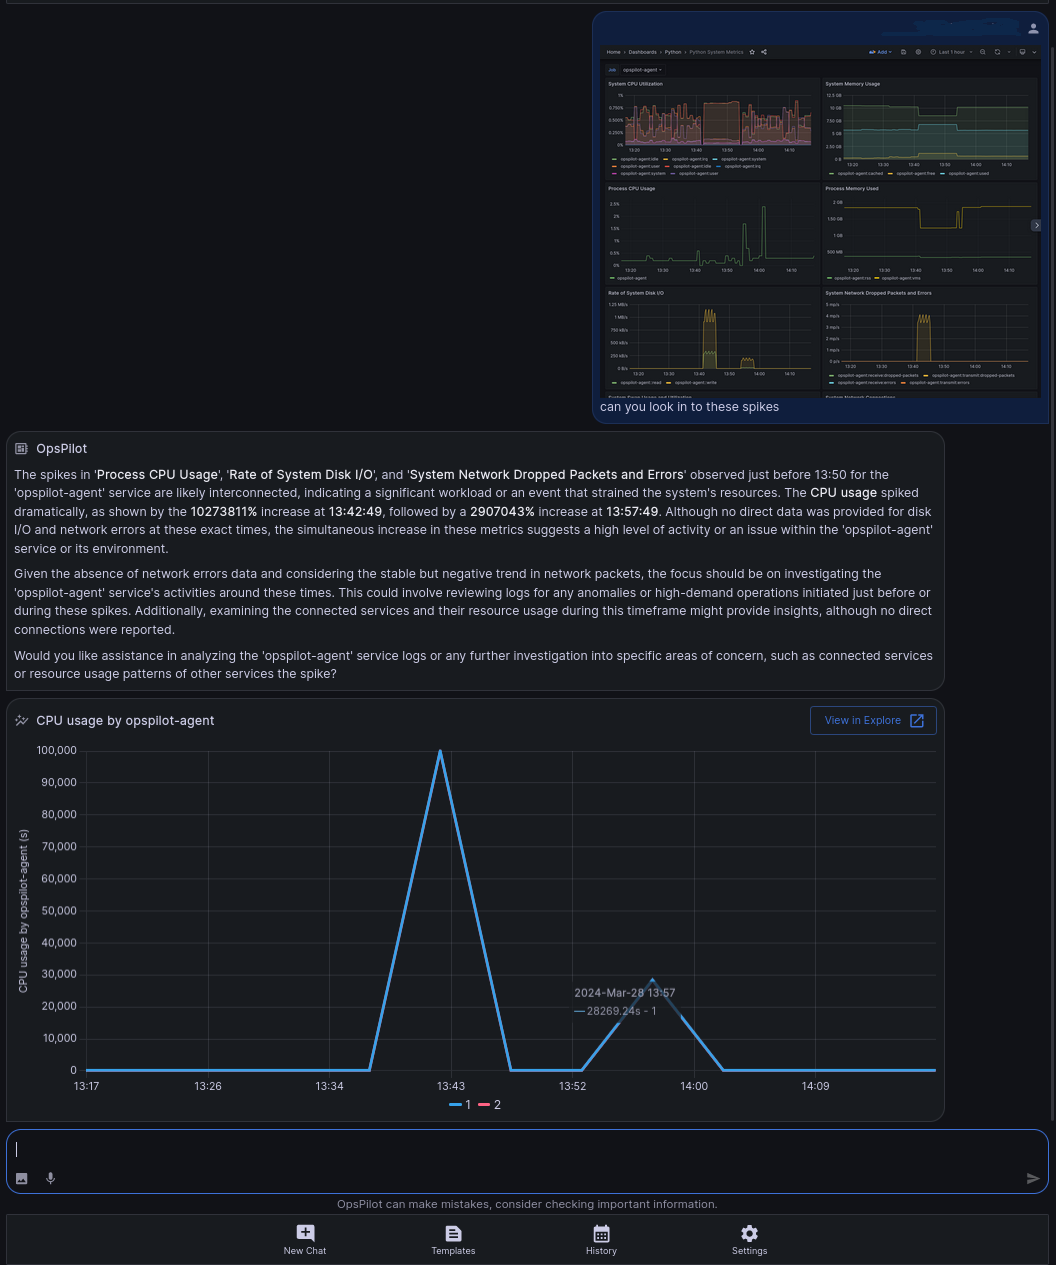
Time ranges - OpsPilot now features automatic time range determination, simplifying the process of querying data within FusionReactor Cloud. OpsPilot will intelligently analyze the data and automatically determine the most relevant time range to address user queries. This enhancement saves time, eliminates guesswork, and ensures that users receive actionable insights based on the most pertinent data available.
-
Graph resolutions: OpsPilot has enhanced the resolution of graphs displayed within the platform, ensuring clearer and more detailed visual representations of data
FusionReactor 12
We're excited to announce several enhancements in the latest release of FusionReactor 12. First off, we've seamlessly integrated the Observability Agent within FRAM, offering enhanced monitoring capabilities for better insights into your applications. Additionally, our system now automatically detects supported application servers within FRAM, streamlining setup and management processes. We've also invested in improving support for Lucee 6 and Tomcat 10 within FRAM, ensuring smoother experiences for users of these technologies. These updates reflect our commitment to empowering developers with robust tools and features to optimize their workflows.
Learn more
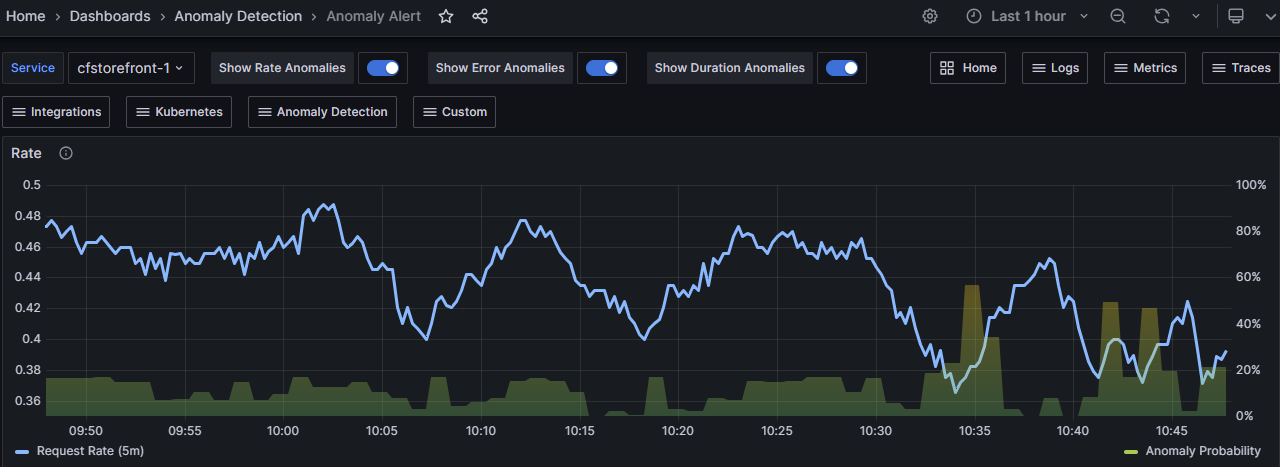
Anomaly Detection (Beta)
For users familiar with FusionReactor Cloud (FR Cloud), the latest exciting update is the introduction of the Anomaly Detection component. This new feature enhances FR Cloud by enabling users to track the probability of anomalies in critical service metrics, known as RED (Request, Errors and Duration rates). It not only allows for closer monitoring of these key metrics but also provides notifications when they exceed set thresholds, offering a more proactive approach to service management.
Learn more
OpsPilot version 1.1.1
New features
- Theme overhaul: OpsPilot now boasts a fresh, modern theme, providing an enhanced visual experience. The revamped theme contributes to a more cohesive and aesthetically pleasing monitoring interface.
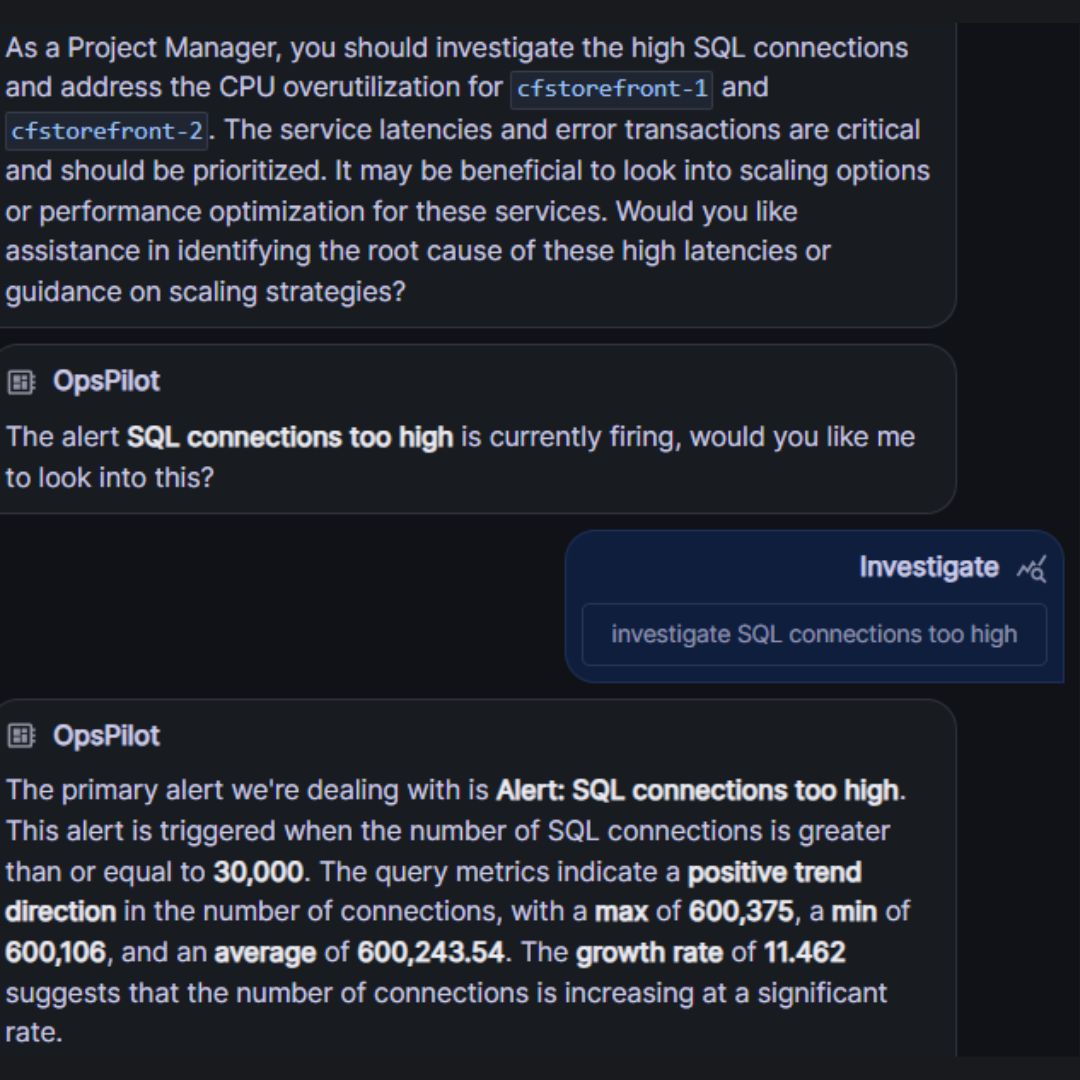
- Alert integration: OpsPilot takes a significant step forward in its capabilities by now providing direct access to alerts firing within FusionReactor. This integration enables users to swiftly investigate and respond to alerts, streamlining the troubleshooting process for enhanced system reliability.
Improvements
-
Graph enhancements: Enjoy a more flexible graphing experience with the ability to add or remove graph series from display using a simple ctrl+click command. This improvement gives users greater control over the visualization of their data, contributing to a more tailored and insightful monitoring experience.
-
Graph accuracy: OpsPilot's graphs have undergone refinements to ensure a more accurate reflection of the data received. Users can now rely on the enhanced precision of graphs, facilitating a clearer understanding of the system's response as portrayed by OpsPilot.
Bug fixes
- Custom commands (HF): Resolving a bug that previously hindered the creation of custom commands, this update ensures a smoother experience for users looking to customize and optimize their monitoring workflows. With this bug fix, OpsPilot maintains its commitment to providing a robust and reliable monitoring solution.
Stay tuned for more updates and enhancements as OpsPilot continues to evolve, delivering an even more intuitive and powerful monitoring experience.
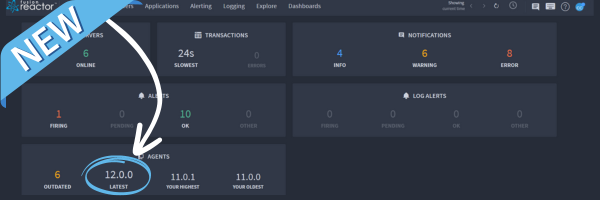
FusionReactor 11
FusionReactor, the renowned application performance monitoring (APM) tool, has reached version 11.0.0. This release provides a significant improvement in security updates, reflecting the company's commitment to keeping your applications safe and secure. However, one notable change in this release is the discontinuation of Java 7 support, a decision made to address critical CVEs (Common Vulnerabilities and Exposures). We're also happy to announce integration with the upcoming Deep release as well as support for WebRequest tracking within servers using Jakarta servlet, which includes later versions of Tomcat and Wildfly amongst others.
Learn more
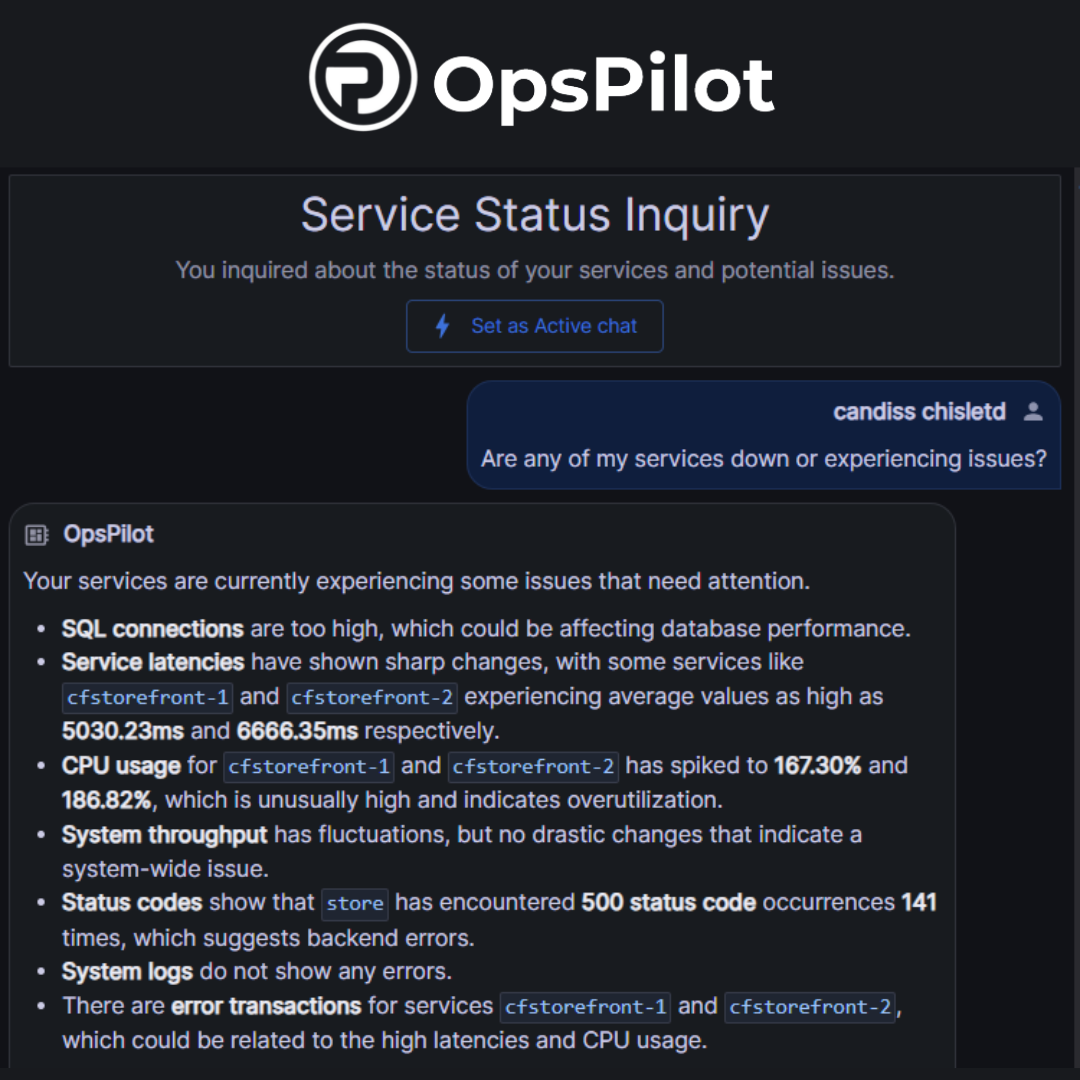
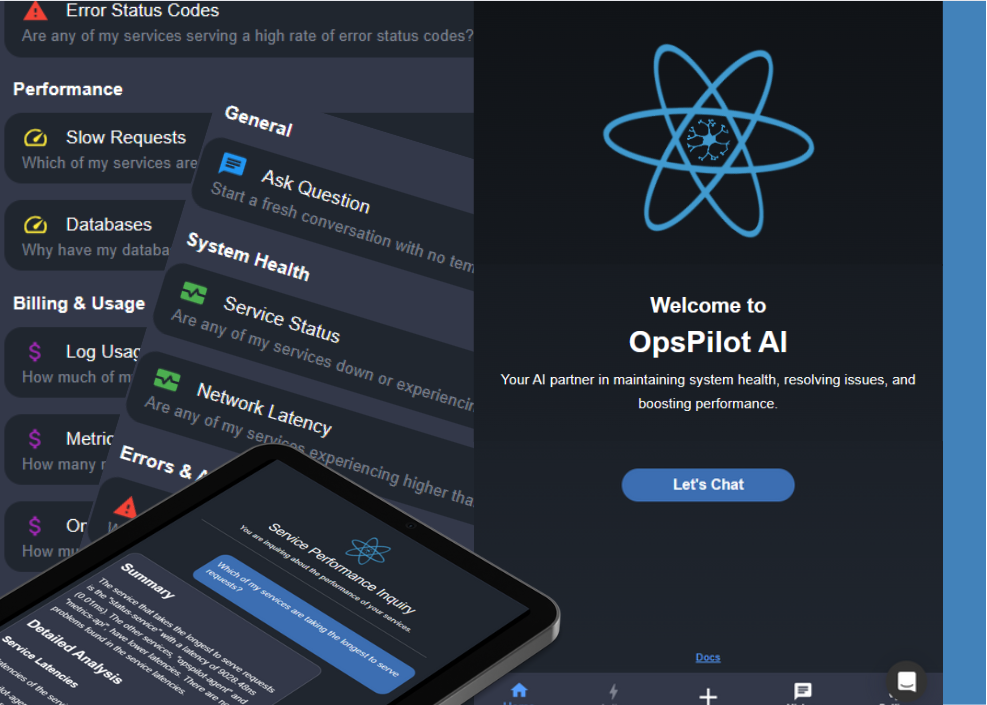
OpsPilot Assistant
At FusionReactor, we're no stranger to the demands of on-call responsibilities because we've encountered those high-pressure situations ourselves. We're also passionate about discovering innovative solutions that enhance an engineer's daily routine, particularly in the realm of incident response management. That's why we're thrilled to unveil OpsPilot, an industry-first, fully launched, and production-ready assistant that serves as the cornerstone of FR Cloud.
Our trusted assistant is the equivalent to having a team of experts on-call, 24/7. With OpsPilot Assistant the opportunities are endless. Conduct a series of automated system evaluations, promptly bringing potential issues in your entire environment to the surface. Or simply pose a question, then let OpsPilot delve into the depths of your system, bringing forth insights that are not just data-driven but context-aware. Armed with the vision provided by OpsPilot, you can swiftly pinpoint the core of any problem and streamline your resolution process for greater efficiency. OpsPilot transforms complex application landscapes into understandable conversations, empowering you with real-time insights at the speed of thought.
Enhanced dashboard navigation
We're thrilled to introduce some exciting enhancements to our dashboards providing you with even more powerful data insights! In our latest update,we've improved the user experience by allowing variables and time picker settings to seamlessly pass between dashboards. Our update allows you to move easily between dashboards ensuring you never lose context while exploring your data as all filters and time values are retained as you switch dashboards. To make navigation a breeze, we've improved the search facilities allowing you to effortlessly locate any dashboard you require. The newly incorporated dropdown dashboard links make it easier than ever to access the information you need. These updates are designed to streamline your dashboard experience and empower you to make data-driven decisions effortlessly.
Servers update
We're excited to unveil the latest enhancements to FusionReactor's servers view, designed with On-Prem parity to elevate your monitoring and troubleshooting experience. Our team has diligently worked to make the servers view clearer and more accessible than ever before. With a refreshed interface, intuitive navigation, and streamlined information presentation, gaining insights into your server's performance has never been easier. Whether you're a seasoned developer or just starting your journey, you'll appreciate the enhanced visibility into key metrics, real-time updates, and advanced analytics, all thoughtfully organized for effortless comprehension.
Coming soon...
Teams & Slack Integrations
OpsPilot Hub will soon expand its integration capabilities with Microsoft Teams and Slack support. These integrations will enable:
- Direct communication with OpsPilot through your messaging platforms.
- Real-time notifications and alerts.
- Collaborative issue resolution.
- Command-line interface for quick actions.
Further integrations
Exporters are available in many forms and allow you to monitor many aspects of your infrastructure. With Kubernetes already added, FusionReactor Cloud will very soon be able to offer more integrations such as AWS, GCP, Mongo and more.