Profiler Example : Read - Delete - Create a new file and add a new lines
The Read_Delete_Create_Write\Example.cfm script is a similar to
the Read_Create_Write_Example.cfm from this example.
However, with the difference that a file is deleted after has been read.
Read_Delete_Create_Write_Example.cfm
<html>
    <head>
        <title> This is a read/write example of ColdFusion process </title>
    </head>
    <body>
        <cffile action="read" file="/opt/applicationservers/coldfusion/11.0/cfusion/wwwroot/Test/myFile2.txt" variable="Message">
        <p>Delete the old file </p>
        <cffile action="delete" file="/opt/applicationservers/coldfusion/11.0/cfusion/wwwroot/Test/myFile2.txt">
        <p> Add a new line to the new file </p>
        <cffile action="write" file="/opt/applicationservers/coldfusion/11.0/cfusion/wwwroot/Test/myFile3.txt" output="new line">
        <cfloop from="1" to="200000" index="i">
            <cfset s = gettickcount()>
            <cffile action="append" file="/opt/applicationservers/coldfusion/11.0/cfusion/wwwroot/Test/myFile3.txt" output="Did you add something_New?">
        </cfloop>
        <cfoutput>
            This is the execution time: #s#
        </cfoutput>
        </br>
        <h2> This is the end of the loop.</h2>
    </body>
</html>
Profiler Results
When the script has been executed, we will be able to find the transaction in the Profiled Thread History tab. ( See screenshot below )

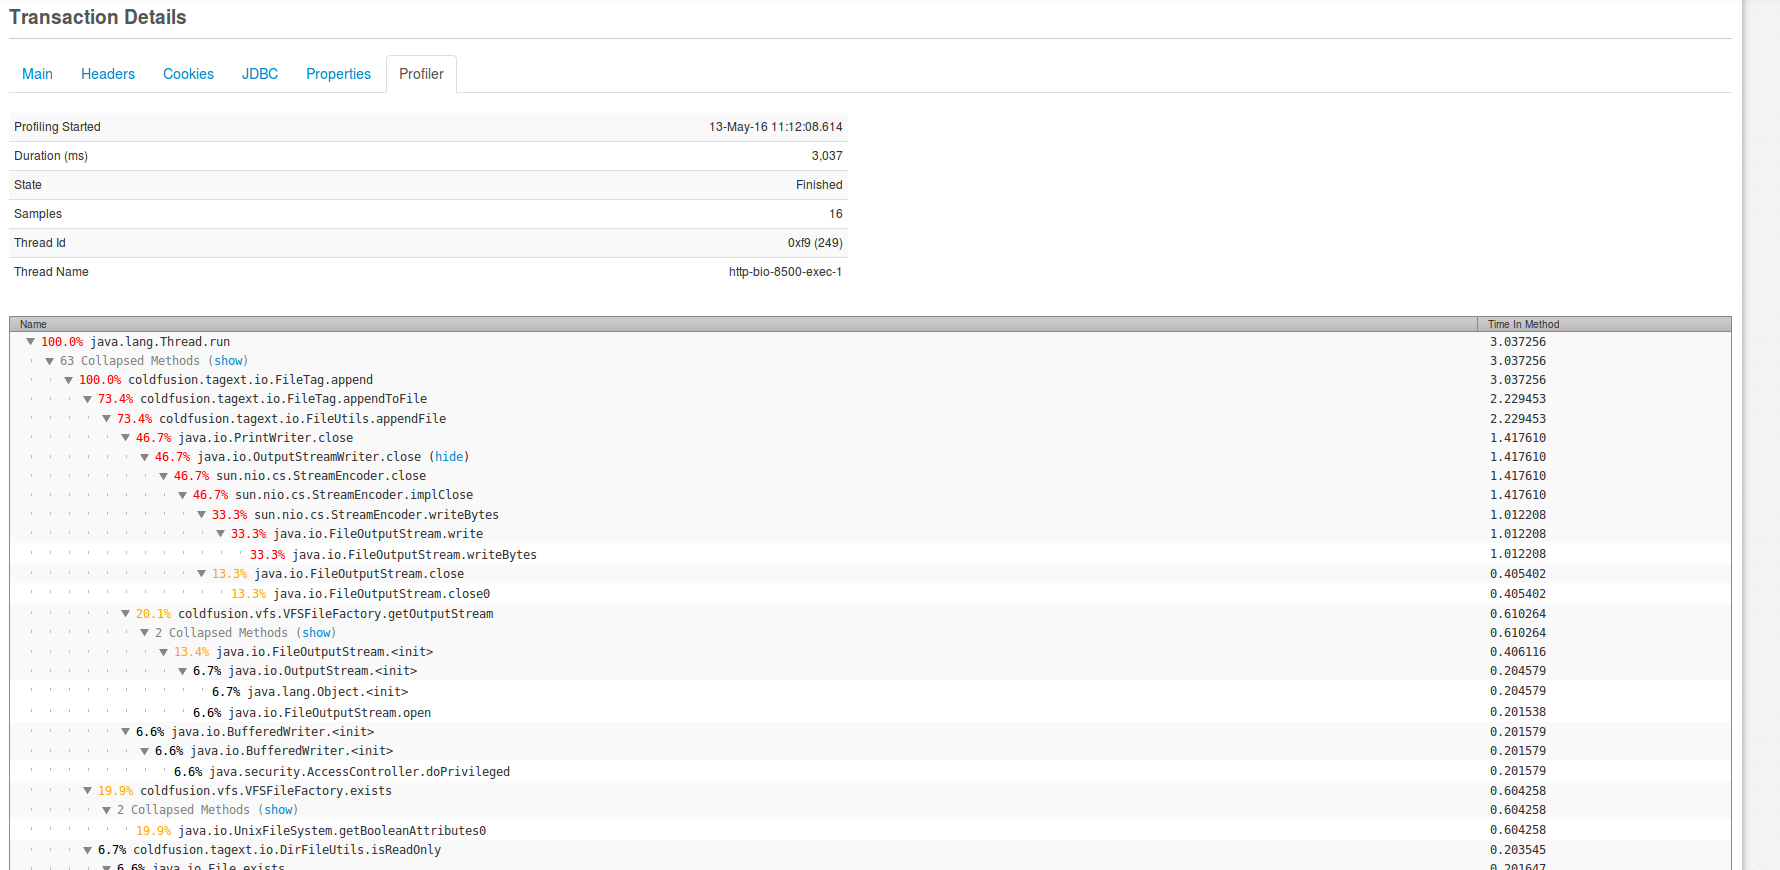
Lets take a better look of the transaction. ( See screenshot below )

By looking the screenshot above, we are able to see a number of differences in performance between the this example and this example
In this example, the
coldfusion.tagtext.io.FileTag.appendToFile method has consumed the
73.4% of the total execution time,
while the java.io.PrintWriter.close method has consumed 46.7%
of the total execution time. Moreover, a specific percent of time was
used for the deletion of the file. So, comparing the two examples
provided, we notice a number of changes related to the consumption of
time.