How to configure the Enterprise Dashboard
The Enterprise Dashboard is a powerful tool providing an overview of your infrastructure from one location.
From this dashboard, you can:
-
monitor the state of group and individual instances
-
set thresholds for instances to enter a warning or error state based on the resource usage.
📖 Learn more: Enterprise Dashboard features.
Below are three common configurations you may want to setup when you using FusionReactor.
Automatically registering FusionReactor instances to the dashboard
We recommend using the Ephemeral Data Service in FusionReactor to automatically register instances. With the Ephemeral Data Service you have the option to automatically add dynamic instances running in Docker, Kubernetes or other virtual environments.
For a working example of configuring automatic registration to the Enterprise Dashboard in Docker:
📖 Learn more: Ephemeral Docker example.
Note
In FusionReactor 8.0.x and below automatic registration of FusionReactor used the FusionReactor API to automatically register instances. To do this you would set the following system properties:
- -Dfrregisterwith
- -Dfrshutdownaction
- -Dfrregisterhostname
- -Dfrregistergroup
This connection method has been deprecated and should no longer supported.
We recommend you remove these arguments and move to the Ephemeral Data Service in FusionReactor 8.1.x and above.
To configure the Ephemeral Data Service you are required to configure the system properties below:
The following properties should be added to the instance hosting the Enterprise Dashboard
| Property | Default Value | Values Accepted | Version Added | Description |
|---|---|---|---|---|
| fr.ed.ds.enable | false | true/false | 8.1.0 | If provided, specifies the server port binding. |
| fr.ed.ds.listen | 0.0.0.0:2106 | hostname:port | 8.1.0 | Specifies the listening IP address and port on the server |
| fr.ed.ds.polltimeout | 1000 | Integer (ms) | 8.1.0 | Specifies the time EDS will wait after attempting to poll data from the client before marking the client as offline. |
| fr.ed.ds.maxdatasize | 20 | Integer (MB) | 8.2.2 | The maximum size of a page or other data transfer that will be accepted over the tunnel. |
The following properties should be added to the instance connecting to the Enterprise Dashboard
| Property | Default Value | Values Accepted | Version Added | Description |
|---|---|---|---|---|
| fr.ed.ds.target | Not defined | hostname:port | 8.1.0 | If specified, causes the instance to attempt to auto-register with the EDS system at the specified address |
| fr.ed.ds.groups | Not defined | Comma-separated list | 8.1.0 | If provided, the instance will auto-register with the ED DS, specifying it is a part of the given groups. |
Note
Be aware that if you are using the Ephemeral Data Service, but have already configured your FusionReactor instances manually or through the FRAPI registration, you will need to remove these entries under the Manage Servers page for registration to take place.
Limitations and tuning
This section discusses known restrictions in EDS.
Enterprise Dashboard latency
We've refactored a lot of how the Enterprise Dashboard works internally to allow it to handle many servers at scale. The data transfer between FRAM and the client's browser has been heavily optimized to provide the same granularity of data but at much less volume, and with greater focus. However, especially when running at large scales, you might see the user interface pause during updates.
- These updates occur every 5 seconds, and their length depends on the choice of browser and speed of your desktop machine.
- The pauses are caused by the Enterprise Dashboard integrating new data into its internal model, and building a new display.
- If you click on a server or group while the dashboard is paused, the click will be registered and the dashboard will reflect the click once the update completes.
- We recommend the Chrome browser for running Enterprise Dashboard clients. In our experience, Chrome has performed the best under test load.
Ungrouped servers appearing during shutdown
During shutdown of instances which have been placed into groups, you may see them appear briefly in the Ungrouped Servers section of the dashboard.
- This effect occurs because instances are first removed from their groups, prior to being completely deleted from the model.
- In order to be as performant as possible, EDS uses an eventual consistency model: synchronization is not enforced between servers and their groups.
- The display can therefore be out-of-sync while servers are added or removed. This state is temporary and will resolve itself, often by the time the next display update cycle has occurred - in 5 seconds. This phenomenon usually only occurs in environments running at very large scale.
Maximum transfer size
The secure tunnel, accessed using the instance's link icon has a maximum transfer size of 20 MB (since FusionReactor 8.2.2). Ephemeral clients which return pages or data which exceed this will trigger the following warning in FRAM's osgi.log, and it's also output to the console the first time it occurs:
- An HTTP message from an ephemeral client was longer than the configured maximum (20 MB). This can be raised by setting '-Dfr.ed.ds.maxdatasize' (in MB) on the dashboard server (FRAM). The content length of the message which could not be processed was 35,882.90 KB.
- Additionally, the failed page is replaced in the user's browser with an Error Retrieving Page screen, which contains much the same information. All FusionReactor pages should be handled with the default 20 MB limit. If you have larger data you need to transfer, you should set -Dfr.ed.ds.maxdatasize in your FRAM server to a larger value, and restart. See the Option Reference below for more details.
Memory
FRAM was originally designed to run administrative tasks and monitoring like the Instance Manager and the Enterprise Dashboard.
- In its default configuration, FRAM uses 64MB of memory. This must be increased proportionally with the number of EDS instances you're going to monitor.
- We recommend starting with a memory value of -Xmx512m and tuning down gradually from there. 512MB should support a (very!) large number of connected instances.
Network and file system (Linux)
A large number of connected ephemeral instances requires the file system and network to be tuned to avoid running out of resources. We've developed the following data using our scaling test bench at AWS, and they have been shown to work with Amazon Linux 2.
- The following values must be changed in /etc/sysctl.conf in order to enable better use of the network and file system under heavy load. The values support fast recycling of sockets and files by the operating system, which is required when high network connection turnover is expected.
-
Append the following values to the /etc/sysctl.conf file. If they exist already, change the values to match.
#Decrease TIME_WAIT seconds
net.ipv4.tcp_fin_timeout = 30
#Recycle and Reuse TIME_WAIT sockets faster net.ipv4.tcp_tw_recycle = 1 net.ipv4.tcp_tw_reuse = 1#Allow more open files fs.file-max=10240 -
The following values should be changed in /etc/security/limits.conf. Again, if they're already configured, change them to match. If they're configured to have higher values than we specified here, leave them alone.
soft  nofile  80000
hard  nofile  80000
Configuring Warning and Error states for instances
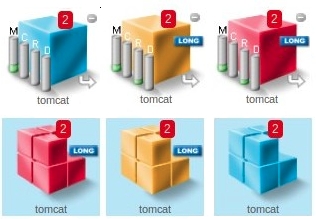
Within the Enterprise Dashboard instances will change colour depending on the state of the instance from BLUE (OK) -> ORANGE (Warning) -> RED (Error).
If any instance within a group changes to a Warning or Error state, the group itself will change to this state.

You can configure when an instance will enter either the Warning or Error state in the Enterprise Dashboard Settings. Changing these settings allows you to monitor the health of your infrastructure and know if you are experiencing any issues quickly.
In Memory you can configure the percentage of Heap memory used required to be a warning or error state.

In Average Request Time you can configure a warning or error for when the average request time in the last 60 seconds ia above a millisecond value.

In JDBC you can configure a warning or error for when the average JDBC request time in the last 60 seconds ia above a millisecond value.

In Slow Requests you can configure a warning or error when the number of Slow requests in the last 60 seconds is above a defined value.

Offline instance alerts
When instances are added to the Enterprise Dashboard either by manually adding the server, or through the Instance Manager by manually adding instances, you will receive alerts in the form of emails if an instance becomes unavailable.
Note
In order to receive these email alerts you must have the email settings for the instance correctly configured.
Learn more
In order to detect if a server becomes unavailable, the Enterprise Dashboard uses a heartbeat mechanism. This means that by default it will attempt to contact the monitored FusionReactor instance, after three failed attempts we assume that the instance is no longer available.
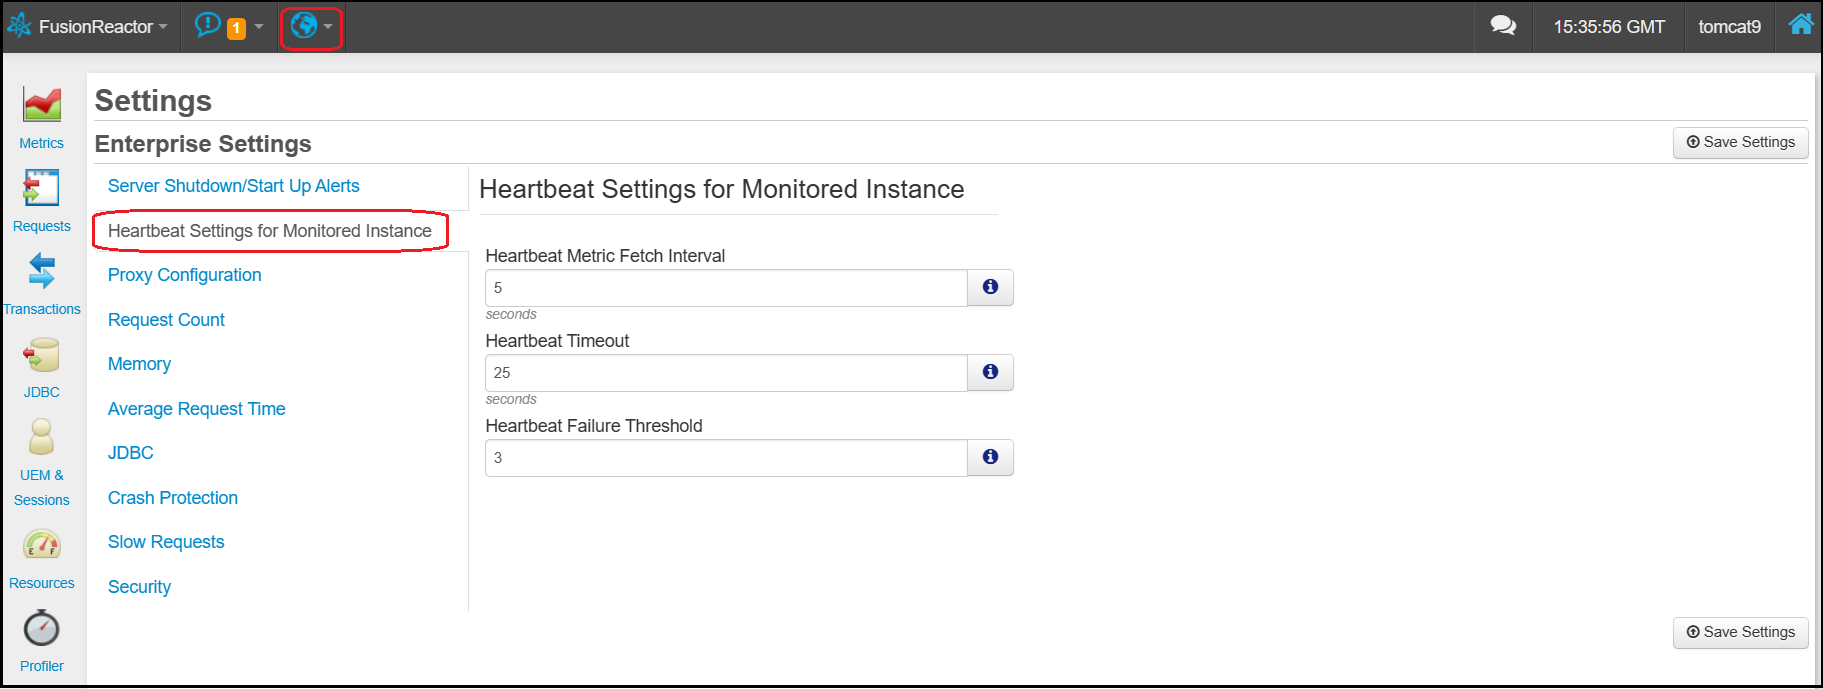
It is possible to configure both the heartbeat settings and alert settings in the Enterprise Dashboard Settings page.

Under Server Shutdown/Startup Alerts you can disable these alerts entirely, or specify whether to receive emails on shutdown only.

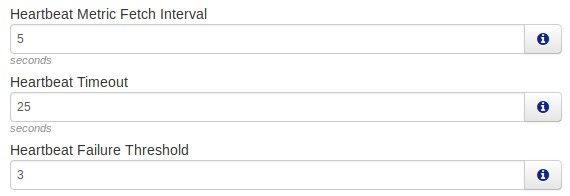
Under Heartbeat Settings you can configure the heartbeat interval, timeout and failure threshold.

While in most cases these settings should provide optimal alerts, it may be that at times your application server stalls and can stop serving requests for a limited time. For example, if a large Garbage Collection is occurring. When this happens it is possible to receive false alarms that your application is unavailable.

Tip
Increase the heartbeat interval or failure threshold to prevent these false alarms.
Need more help?
Contact support in the chat bubble and let us know how we can assist.