User guide
OpsPilot is meticulously designed to elevate observability for every team member, transcending the boundaries of engineering to construct a comprehensive context around your systems. Through the fusion of large language models (LLMs) with our extensive telemetry data platform, we've engineered an AI companion adept at comprehending the nuances inherent in both your system and OpsPilot's functionalities. OpsPilot streamlines the comprehension of your stack's intricacies, facilitates the resolution of service interruptions, and enhances productivity by facilitating simple inquiries in plain language.
Access
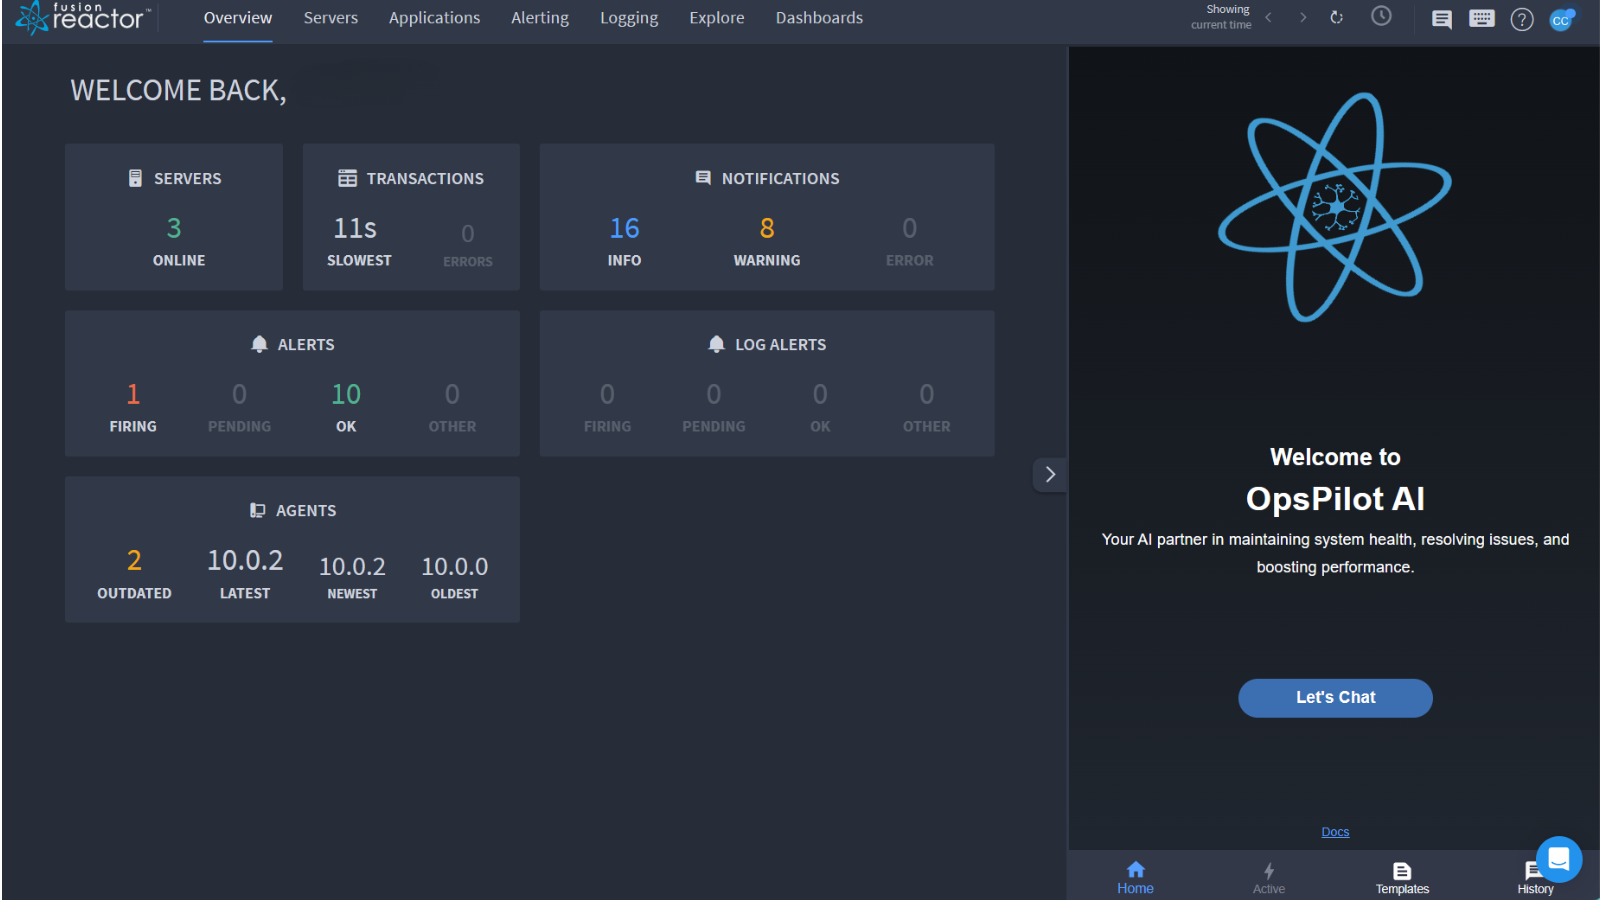
OpsPilot opens by default upon login, providing instant access to its wealth of monitoring and troubleshooting capabilities. The ingenious concept behind the slider is its unobtrusive presence, meaning OpsPilot is always ready to assist without getting in the way.
The OpsPilot Assistant is designed to be a constant and trusted helper; it even has the potential to view and understand the main screen's functionality, with further developments likely on the horizon. In the grand scheme of our cloud platform, the OpsPilot Assistant serves as the central hub, around which other features are intricately woven to create a seamless and dynamic user experience.
Info
The OpsPilot Assistant can also be accessed by selecting the OpsPilot integration buttons within the product.
Conversation templates
The OpsPilot Assistant takes the complexity out of monitoring your application: pre-defined question templates are built right into the system. These conversation templates consist of carefully designed questions to simplify the monitoring process, making it effortless for users to gather crucial insights and track performance metrics. Whether you're new to monitoring or a seasoned professional, these intuitive tools help streamline your workflow, ensuring that you have the right data at your fingertips to assess your application's health and swiftly address any issues that may arise. With OpsPilot, monitoring your application becomes not just efficient but also exceptionally user-friendly.
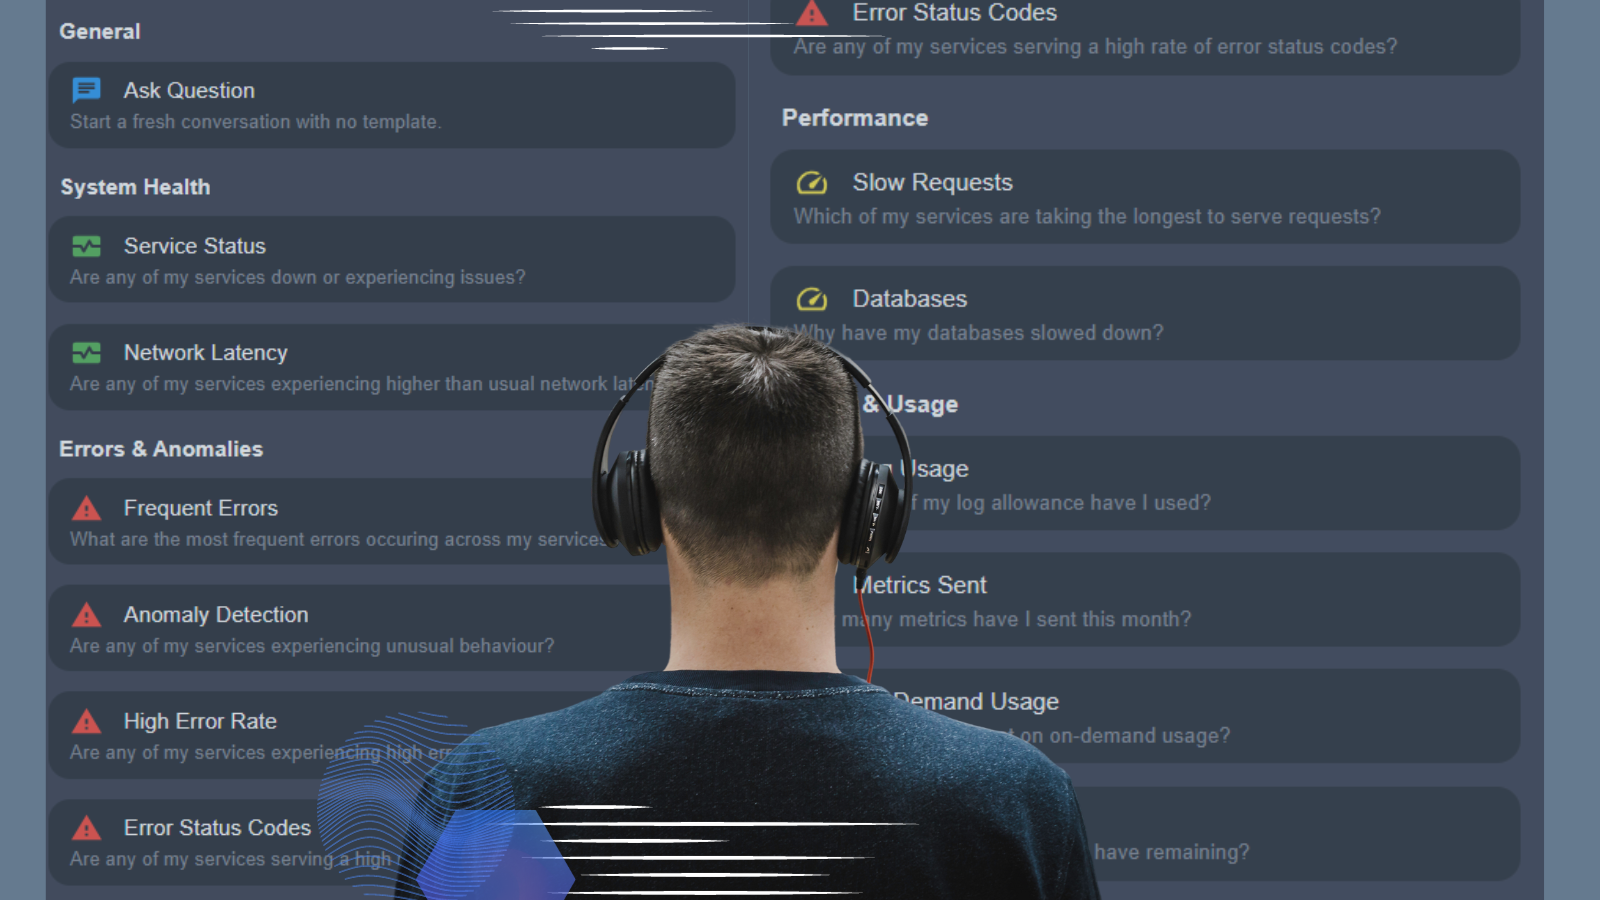
The OpsPilot Assistant currently has the following custom templates:
Info
New conversation templates will continue to be added over time.
System health
Monitor your entire system health with OpsPilot. Our helpful assistant can help you to identify and address issues proactively, ensuring your application operates optimally and delivers a seamless user experience.
Benefits of using OpsPilot to monitor system health:
-
OpsPilot Assistant is designed to help you handle your entire stack so you're less likely to need to involve multiple specialists for different parts of your systems.
-
Save valuable time by getting OpsPilot to check all your systems are healthy.
-
Allow OpsPilot to help bridge the knowledge gaps seamlessly. For instance, in the event of a problem with one CF server, if your engineer encounters an unfamiliar issue with a Redis node, they can simply ask OpsPilot to provide the missing information and possibly shed some light on the specific aspect they need clarification on.
Available templates:
| Issue | Question |
|---|---|
| Service status | Are any of my services down or experiencing issues? |
| Network latency | Are any of my services experiencing higher than usual network latency? |
Errors
By continuously monitoring your application's performance, OpsPilot proactively identifies errors and anomalies in real-time, allowing for swift intervention and issue resolution. With a single click or query, you get an overview of the overall health and performance of your application. It's perfect for quickly assessing if everything is running smoothly or if there's a glaring issue that needs immediate attention. For example, you can click on a single error notification and instantly OpsPilot shows the broader context of how that error fits into the larger picture of your application's performance. Or, if you want to investigate a particular error in granular detail, you can do so effortlessly using one of OpsPilot’s carefully selected templates.
Benefits of using OpsPilot to help you explore errors:
-
When confronted with unfamiliar errors, OpsPilot likely has the answers. It offers a wealth of context to help you quickly understand and address issues.
-
OpsPilot provides valuable context to uncover and resolve problems you might not even be aware of, enhancing your ability to maintain a smooth-running system.
-
With OpsPilot, there's less need to individually check each service. This streamlines your monitoring process, saving time and effort.
Available templates:
| Issue | Question |
|---|---|
| Frequent errors | What are the most frequent errors occurring across my service? |
| Anomaly detection | Are any of my services experiencing unusual behavior? |
| High error rate | Are any of my services experiencing high error alerts? |
| Error status codes | Are any of my services serving a high rate of error status codes? |
Tip
OpsPilot Assistant can also be asked more direct questions, such as:
Are there any errors occurring in application X?
Does service Y have any errors?
Performance
OpsPilot Assistant is your own personal assistant helping you deliver the desired level of functionality, responsiveness, and efficiency by optimizing your application’s performance.
Benefits of using OpsPilot to help you monitor performance:
-
OpsPilot lessons the need for individual service checks, streamlining your monitoring process and saving you time and effort.
-
If you encounter an unfamiliar slowdown, OpsPilot likely has the answer. It possesses extensive context to swiftly identify and address issues that may perplex you.
-
Beyond just code-related performance changes, OpsPilot can also spot external factors influencing your system. Its vast knowledge of external systems enables it to detect these influences, helping you respond effectively to maintain optimal performance.
Available templates:
| Issue | Question |
|---|---|
| Slow requests | Which of my services are taking the longest to serve requests? |
| Databases | Why have my databases slowed down? |
Billing & usage
OpsPilot Assistant is your go-to solution for effortless billing and usage checks.
Benefits of using OpsPilot:
-
Reduce the need for reaching out to sales and waiting for a human response.
-
Keep on top of your finances using OpsPilot and gain transparency in your expenditure.
-
Access tailored recommendations for optimizing your spending and resource allocation.
Available templates:
| Issue | Question |
|---|---|
| Logs usage | How much of my log allowance have I used? |
| Metrics sent | How many metrics have I sent this month? |
| On-demand usage | How much have I spent on on-demand usage? |
| OpsPilot tokens | How many OpsPilot tokens do I have remaining? |
General
OpsPilot is capable of providing real-time status updates and comprehensive overviews, ensuring you're informed about the health and performance of your systems using various capabilities. These include, but are not limited to, the following:
-
Error & slow request analysis
-
Traffic & request analysis
-
Service metrics analysis
-
Service health & error reporting
-
Error log analysis
-
Resource utilization & performance
-
Advanced analysis & management
Selecting Blank template displays the following screen which offers some suggested prompts.
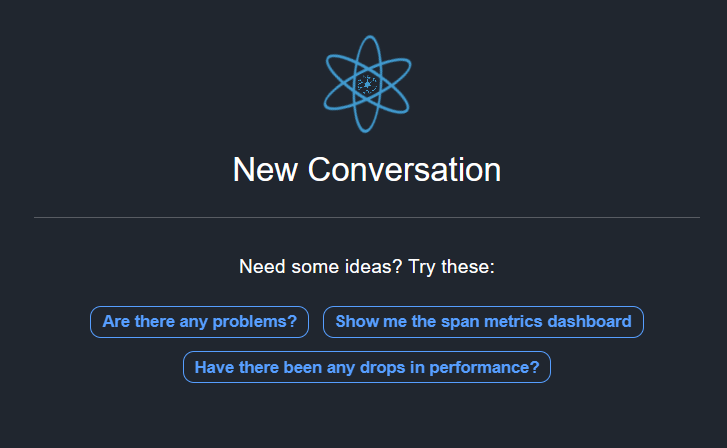
Alternatively, you can input your own questions in the box at the bottom of the screen.

OpsPilot will respond to your queries using a comprehensive language model to give insightful human-like responses. With OpsPilot, you can ask questions in plain English and receive relevant insights and recommendations. We enhance the prompts with additional context, to provide more accurate and relevant responses to your questions.
Should you receive an answer that perhaps lacks the expected level of detail, you can ask follow-up questions using plain language to refine your initial inquiry. This iterative approach can help clarify uncertainties and uncover deeper insights, enabling the user to gain a better understanding of the subject matter at hand.
OpsPilot can be given information about your system structure or the specific issue you are having that it will utilize for later questions in the conversation.
Warning
As the OpsPilot uses previous prompts and responses to reply to a query, long involved responses can prove costly. For further information regarding OpsPilot token usage costs, refer to the Billing page.
Example questions
What metric can I use to alert on CPU usage for jetty-1?
Are there alerts firing right now?
Do I have any performance issues in cfstorefront1?
Does the application store have any errors?
Show me a dashboard about my database usage.
OpsPilot Vision
OpsPilot introduces OpsPilot Vision, a groundbreaking feature that enriches its capabilities by allowing users to upload images for added context to their inquiries. With OpsPilot Vision, users can now provide supplementary visual information alongside their questions, enabling OpsPilot to deliver more comprehensive and tailored responses.

Images can be uploaded to OpsPilot Vision in three ways:
-
Copy an image to your clipboard and paste it directly into the text box within OpsPilot.
-
Click on the Attach Image button located in the bottom left corner of OpsPilot to upload an image.

- Drag and drop an image from your file explorer directly into OpsPilot to upload it.
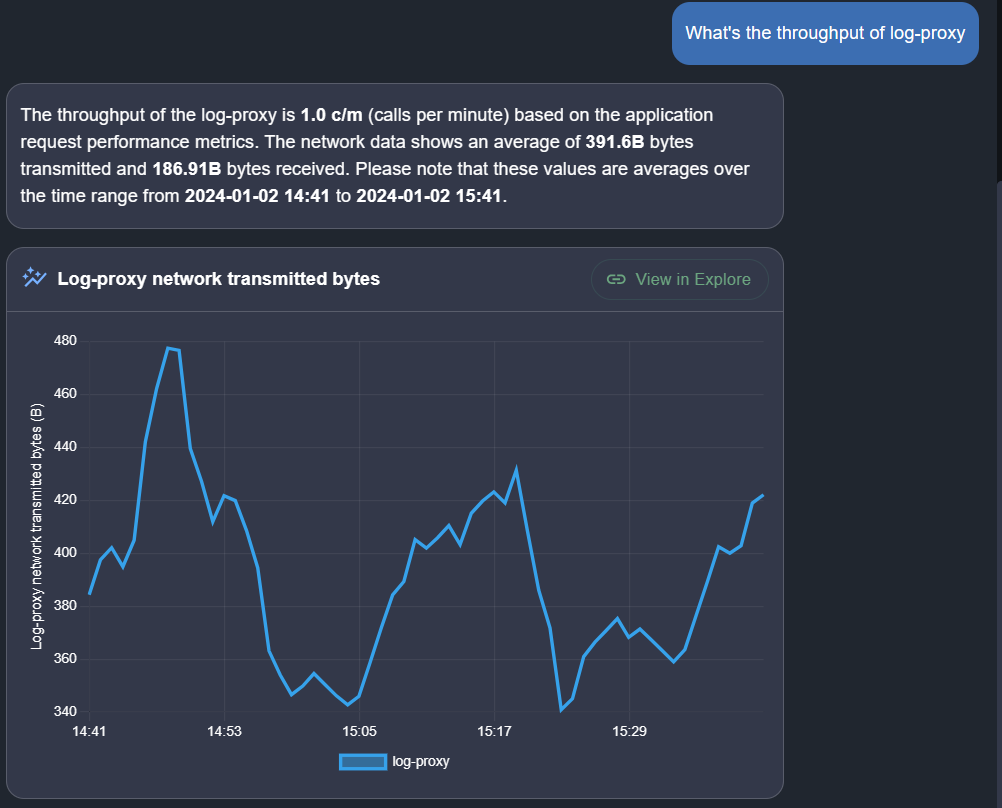
Graph messages
Effortlessly gain deeper insights into your system's performance and health by visualizing complex datasets with OpsPilot. Graph messages provide clarity within the intricate web of information, facilitating the quick identification of trends and anomalies at a glance. OpsPilot further enhances exploration capabilities by enabling users to delve deeper through the seamless opening of related dashboards or the Explore page. This can be achieved with a simple push of a button, offering a convenient and efficient way to investigate and analyze system data.
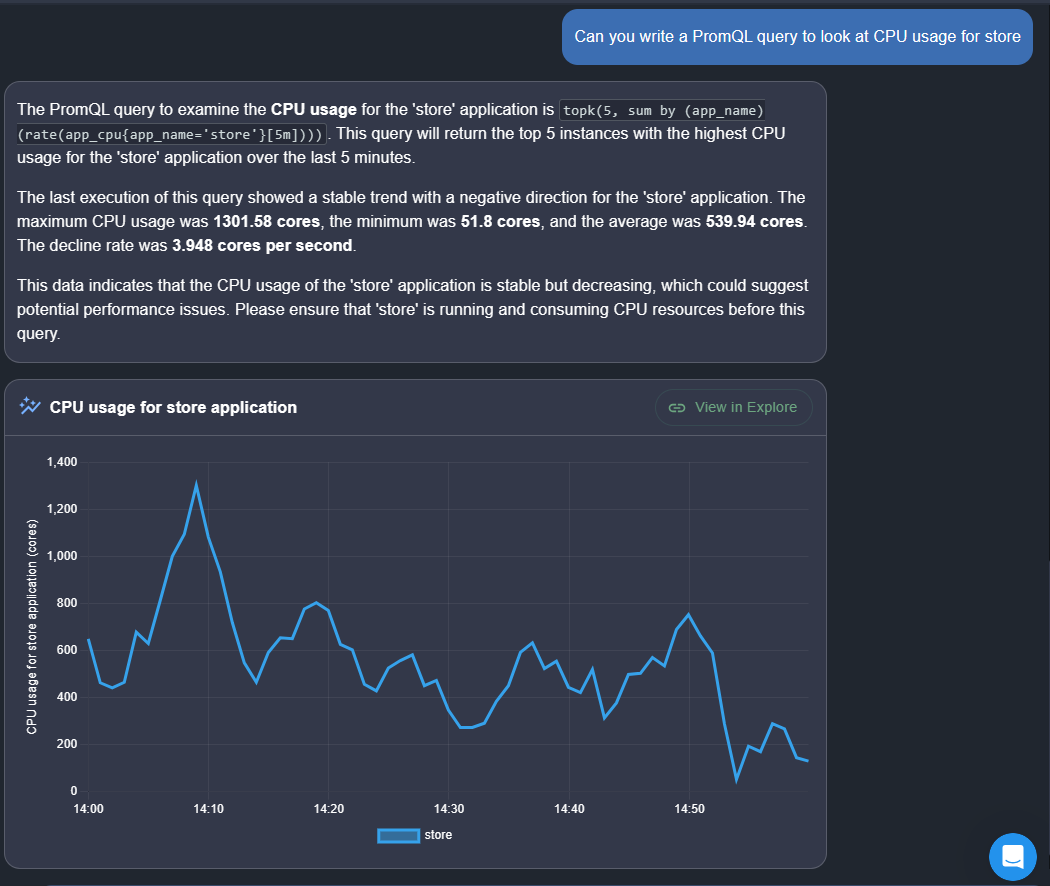
PromQL queries
OpsPilot achieves a significant advancement through its capability to generate and execute PromQL queries, facilitating the extraction of targeted information to address your inquiries. This feature empowers users to pose nuanced questions about their system's metrics, ensuring the delivery of more precise and actionable answers. Unlock the full potential of your telemetry data, streamlining the process of extracting meaningful insights from the system's metrics.
Commands
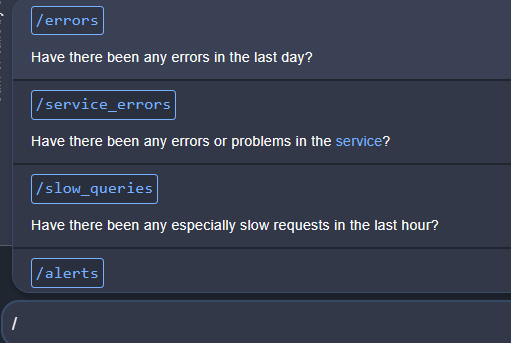
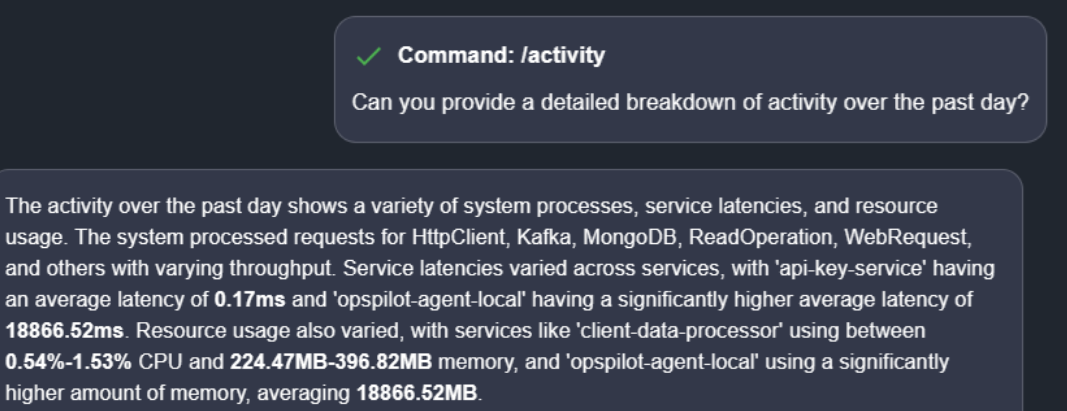
OpsPilot understands the value of efficiency in operations, and with the latest update, executing repetitive tasks becomes a seamless process. Simply start by typing ‘/’, to see a list of available commands. Click on the command you require and tap the send button.
NLP-powered preferences
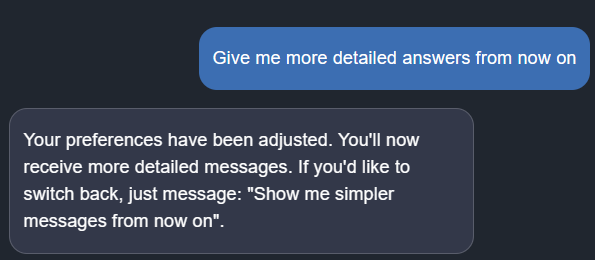
OpsPilot now embraces Natural Language Processing (NLP), allowing users to customize their experience. Tailor OpsPilot to align with your preferences, including adjusting answer detail levels and influencing responses based on your user role. Your interaction with OpsPilot has become more personalized and efficient than ever before.
Answer detail levels
OpsPilot introduces a highly customizable feature that empowers users to set their preferred level of answer detail. Recognizing that different situations may call for varying depths of information, this functionality allows you to fine-tune your monitoring experience.
Whether you prefer streamlined, high-level insights for a quick overview or seek more in-depth, granular data for thorough analysis, OpsPilot adapts to your specific needs. With this capability, you can effortlessly toggle between simpler or more comprehensive answers, ensuring that you always receive the level of detail that best serves your monitoring and troubleshooting objectives.
User role
OpsPilot introduces a unique capability that enables users to tailor their experience based on their specific user role. This means you have the power to influence the responses you receive, adjusting the level of detail or specificity to align with your role's requirements. Whether you're a developer seeking granular insights or a manager looking for high-level overviews, OpsPilot's NLP-powered user role customization puts you in control, ensuring a personalized and efficient experience tailored to your unique needs.
Auto-complete functionality
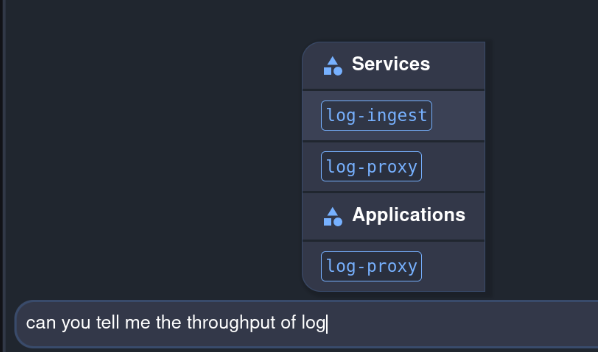
OpsPilot is more intuitive with the introduction of auto-complete functionality. Enjoy the convenience of suggestions for services, applications, commands, time frames, and status codes. Accelerate your workflow with quick and accurate auto-completions.
Query specific time frames
Whether you need to scrutinize recent performance data, investigate anomalies from a particular week, or review long-term trends, OpsPilot is at your service. Simply request information for the time frame of your choice, and OpsPilot swiftly generates insights tailored to that period. This feature ensures that you have the flexibility to focus on the time intervals that matter most to your monitoring and analysis efforts, empowering you to pinpoint issues, track progress, and make data-driven decisions with precision and confidence.
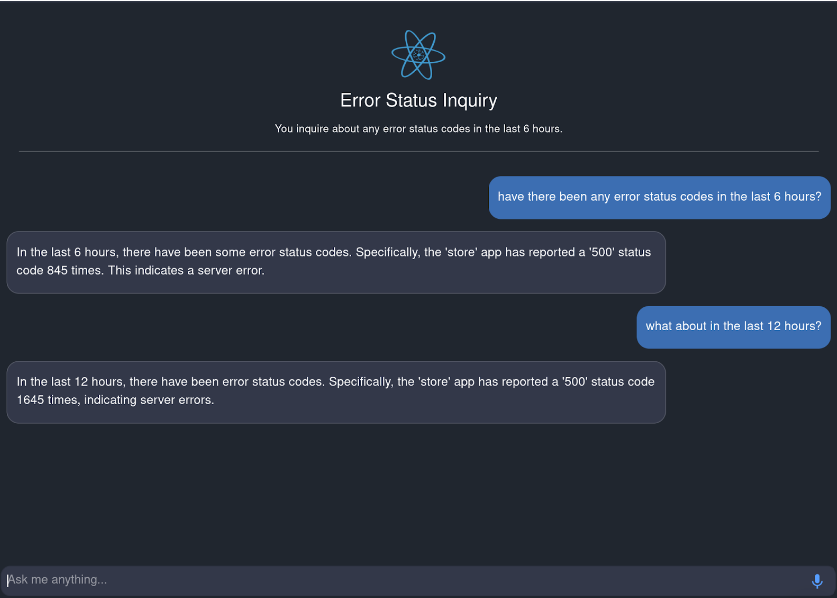
Real-time error notifications & code solutions
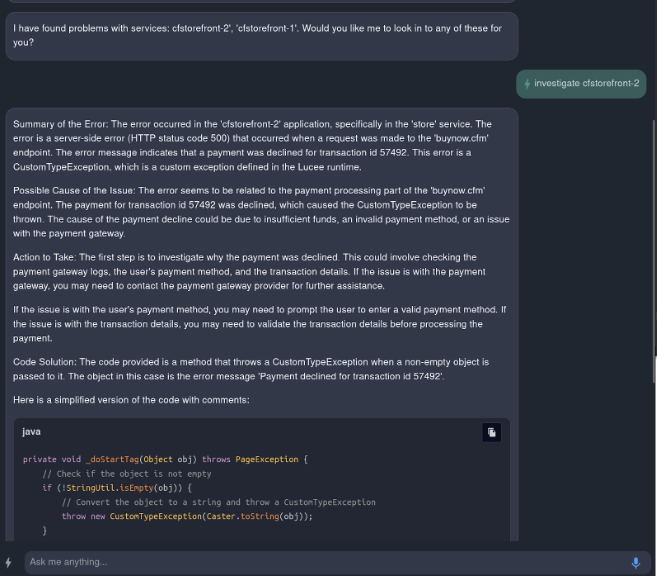
OpsPilot Assistant boasts an invaluable capability that keeps you informed about errors within your services. When responding to a query regarding any existing problems, OpsPilot promptly notifies you with a clear and concise message if any issues are detected. This capability not only expedites the troubleshooting process but also empowers you with actionable insights and solutions, ensuring that you can swiftly address and resolve issues as they arise, enhancing the overall reliability and performance of your applications.
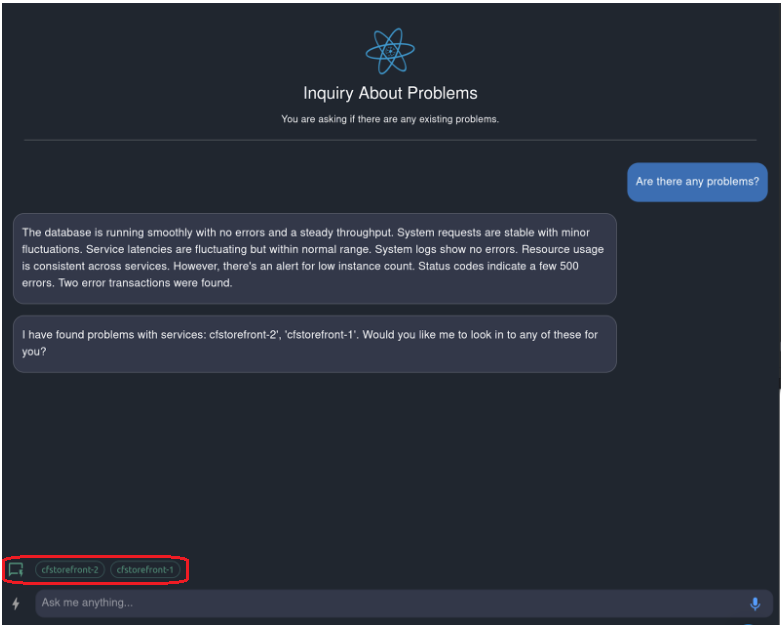
What sets this feature apart is its ability to provide more than just an alert. With OpsPilot, you have the option to dive deeper into the issue by clicking on one of the displayed green buttons circled in red in the above image. This action not only offers a comprehensive breakdown of the problem but, in some cases, can even provide a code solution tailored to your exact codebase.
Info
OpsPilot can also extend this functionality to services exhibiting performance issues that require optimization.
View chat history
OpsPilot offers a convenient feature that allows users to access and review their chat history seamlessly. Whether you need to revisit a past conversation for reference or track the progression of discussions, the History feature empowers you to do so effortlessly. Simply click the History icon in the taskbar, and you'll find a comprehensive record of your previous interactions with OpsPilot.

This feature enhances user experience and ensures that important information and insights shared in conversations are readily accessible whenever needed, facilitating a more efficient and informed monitoring process.
OpsPilot intuitive integration points
OpsPilot is seamlessly integrated into the FusionReactor UI at key points where it can provide the most contextual value. These integration points include error logs, stack traces exceptions as well as being able to explain code.
Wherever the blue OpsPilot AI link is displayed, users can easily access relevant explanations and solutions to the issue at hand.
Instant Error Analysis & Solutions with FusionReactor OpsPilot AI from FusionReactorAPM on Vimeo.
Error context
🔎Find it:
FusionReactor > Applications > Errors > Trace > Error Snapshot
FusionReactor > Servers > Tracing > Trace > Error Snapshot
The error context integration can be found anywhere there is decompiled code.
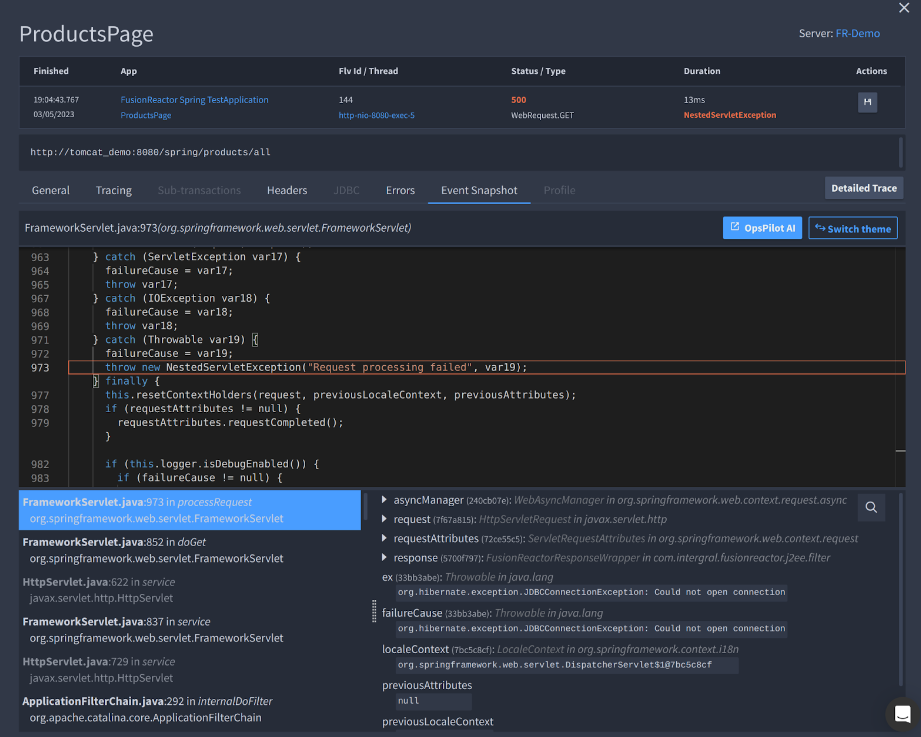
Selecting the blue OpsPilot AI button will send details about how the error was thrown into OpsPilot. You will then be provided with a general explanation of the method and OpsPilot will point out any potential causes of errors.
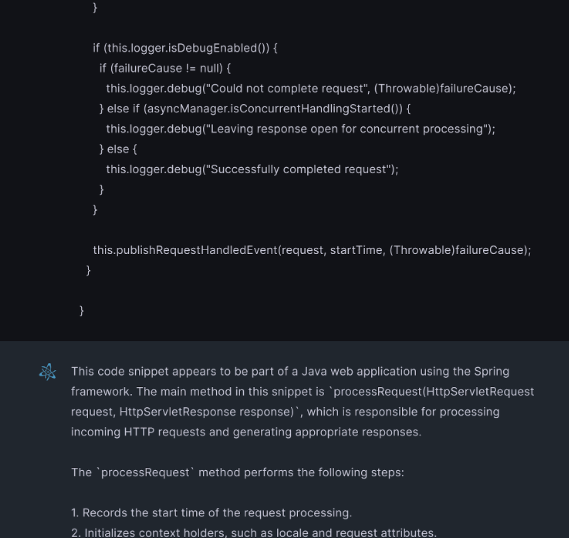
Once in OpsPilot, you can then continue the conversation with the OpsPilot Assistant and ask further questions about the code snippet provided.
Example OpsPilot code requests
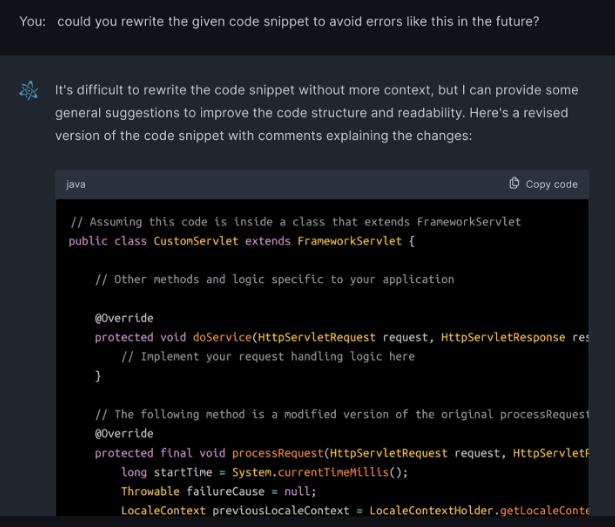
Rewrite code
OpsPilot can even rewrite the code for you to avoid future issues.
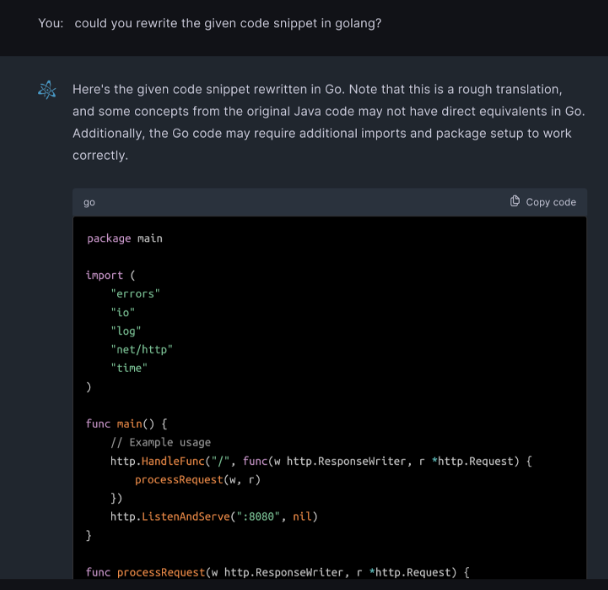
Translate code
OpsPilot can be asked to translate the code into another programming language for usage or just to help you understand it.
Code helper
🔎Find it:
FusionReactor > Applications > Errors > Trace > Error Snapshot
FusionReactor > Servers > Tracing > Trace > Error Snapshot
The code helper feature can be used in any place with decompiled code.

To use the code helper feature, simply highlight a portion of code and right click to open the menu. Three options will be displayed:
-
Debug code: Provides suggestions on areas of the given code that could potentially causes errors and how to avoid them.
-
Explain code: Gives a detailed explanation of what the given code is doing.
-
Suggest optimization: Offers suggestions on how to optimize the readability, structure and performance of the the given code.
Select any one of the three options to send the code to OpsPilot for an explanation.
Profile
🔎Find it:
FusionReactor > Applications > Errors > Trace > Profile
FusionReactor > Servers > Tracing > Trace > Profile
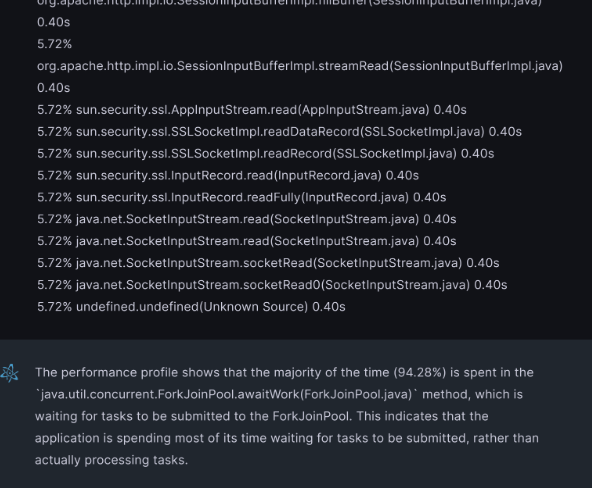
The profile integration can be found anywhere that gives a profile.

Selecting the OpsPilot AI button sends information about the profile to OpsPilot which will initially give an explanation of the profile and where any issues may be located.
Log explain
🔎Find it:
FusionReactor > Logging > Logs
FusionReactor > Explore > Logs
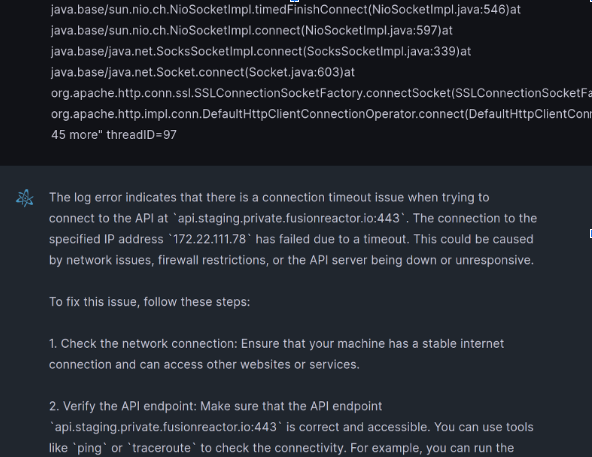
The log explain integration can be found anywhere there are logs.
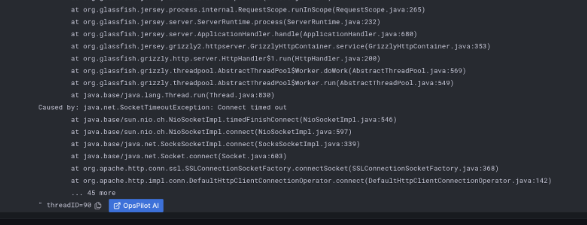
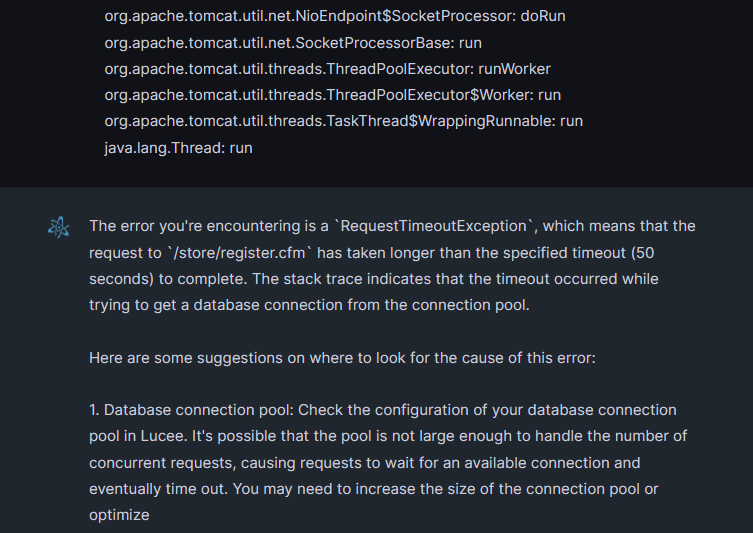
Selecting the OpsPilot AI button sends the given log to OpsPilot where it is analyzed. OpsPilot Assistant provides an explanation of the type of the log and how it is generally caused as well as offers potential fixes.
Stack trace
🔎Find it:
FusionReactor > Applications > Tracing > Trace > Error Output
FusionReactor > Servers > Stack trace
The stack trace button is located anywhere there are error stack traces.

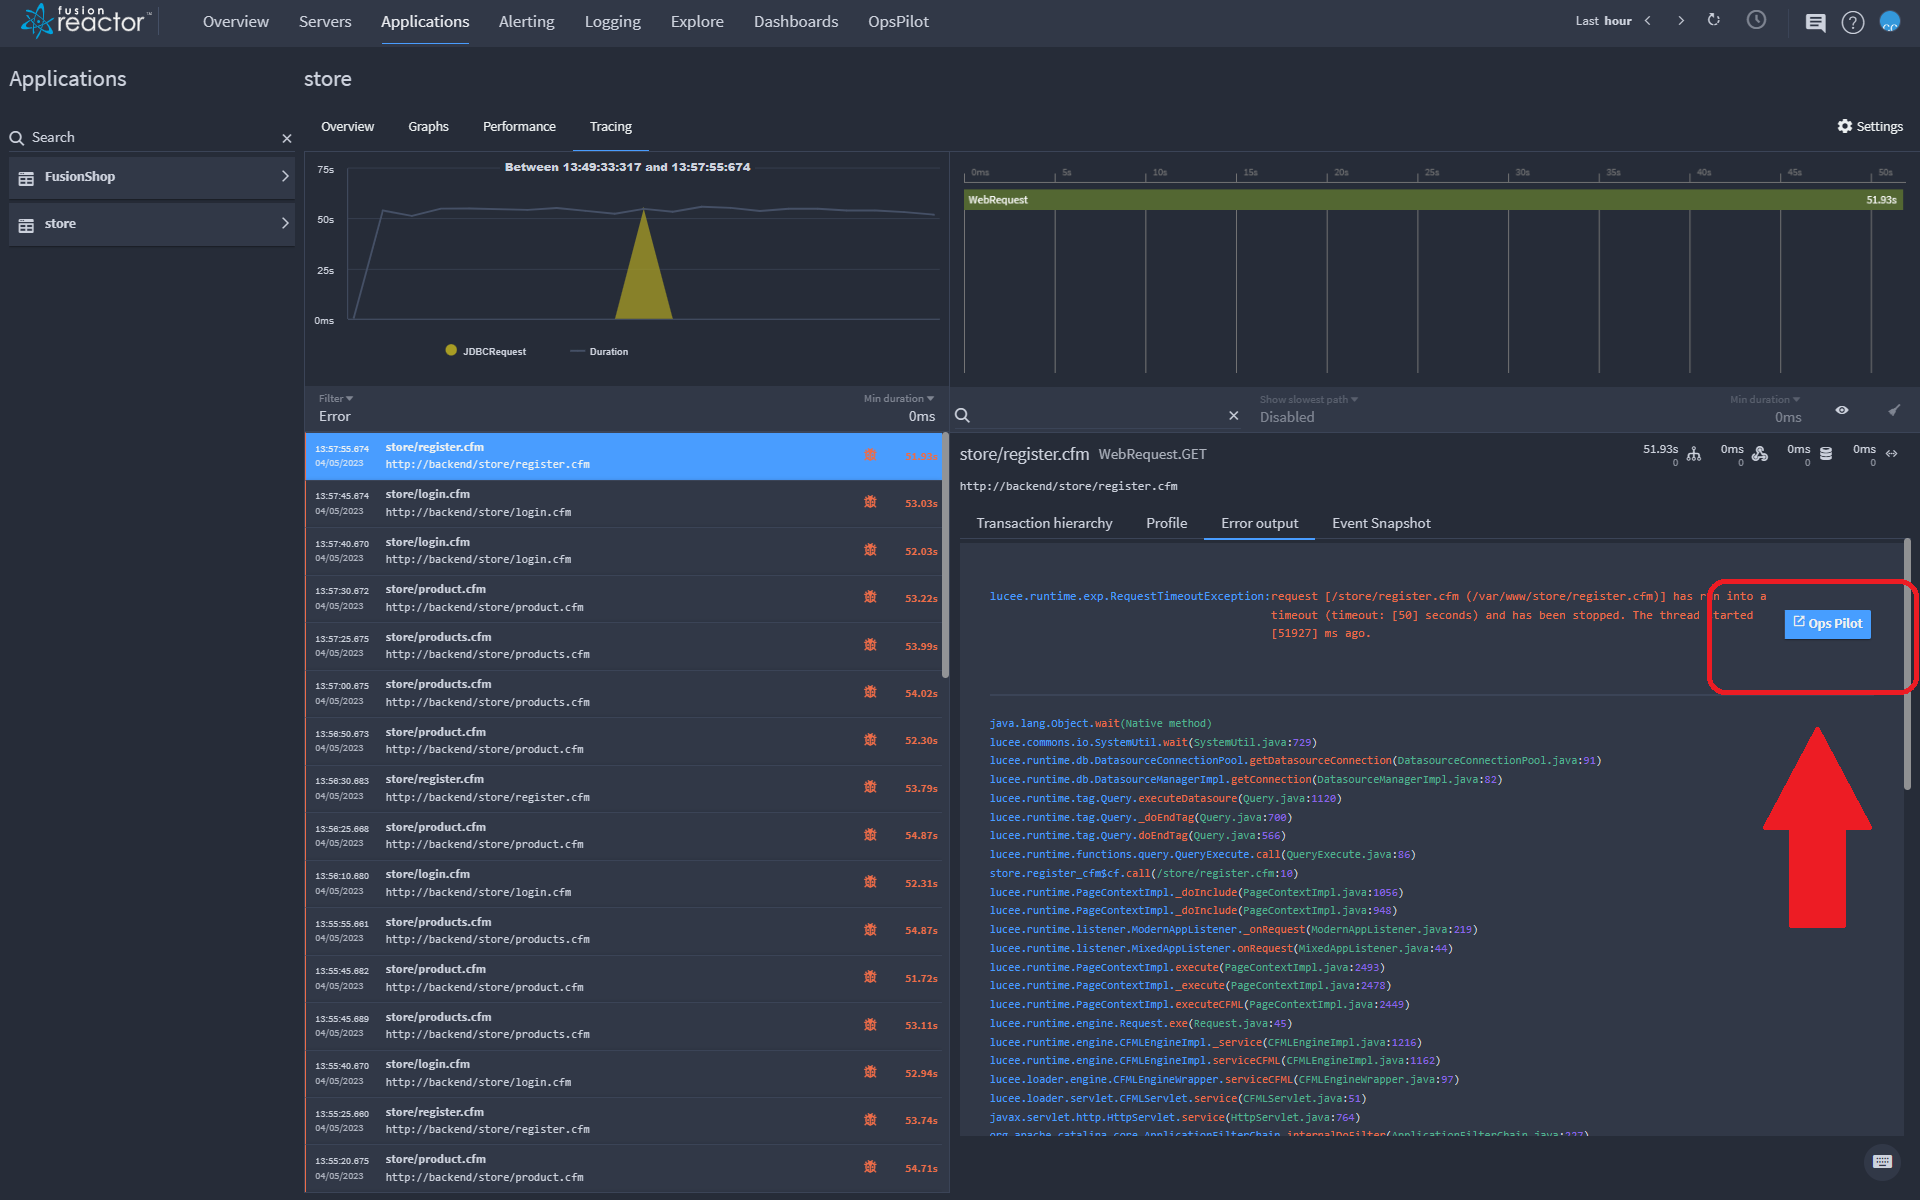
Clicking the blue OpsPilot AI button to the right of an error will provide the stack trace information to OpsPilot which will give you general insight into the stack trace and provide potential causes of the error. You can choose to continue the conversation if required by asking OpsPilot targeted questions to dive deeper and fix the problem.
Voice mode
OpsPilot allows you to send a voice message instead of typing your query. This is yet another time-saving feature of the assistant.
Using voice mode:
-
Open OpsPilot (if not already open by default).
-
Click the blue microphone icon.
-
Wait for the ‘I’m listening’ written response.
-
Ask OpsPilot your question. For example, ‘Do I have any errors?’
Tip
While recording a question, you can click the X icon to cancel it.
Need more help?
Contact support in the chat bubble and let us know how we can assist.
