How to find data on your slowest traces using Dashboards
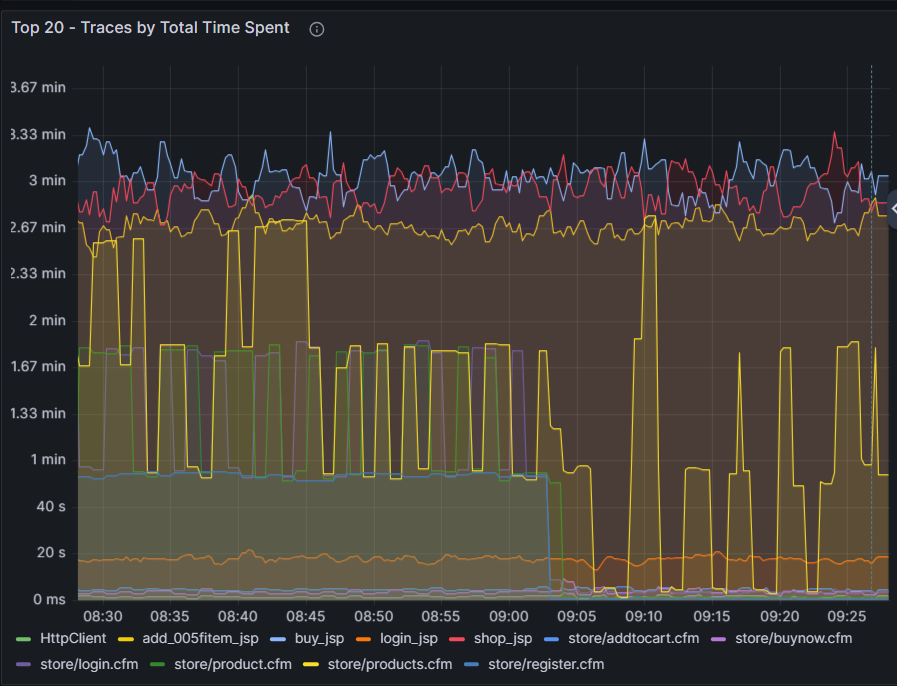
You can find data on your slowest traces by using Dashboards. For example, the Request Performance dashboard can provide you with the top 20 traces by Total Time Spent.
This graph will display your top traces by their overall execution time, focusing on potentially slower or more resource-intensive operations with your applications.
Need more help?
Contact support in the chat bubble and let us know how we can assist.